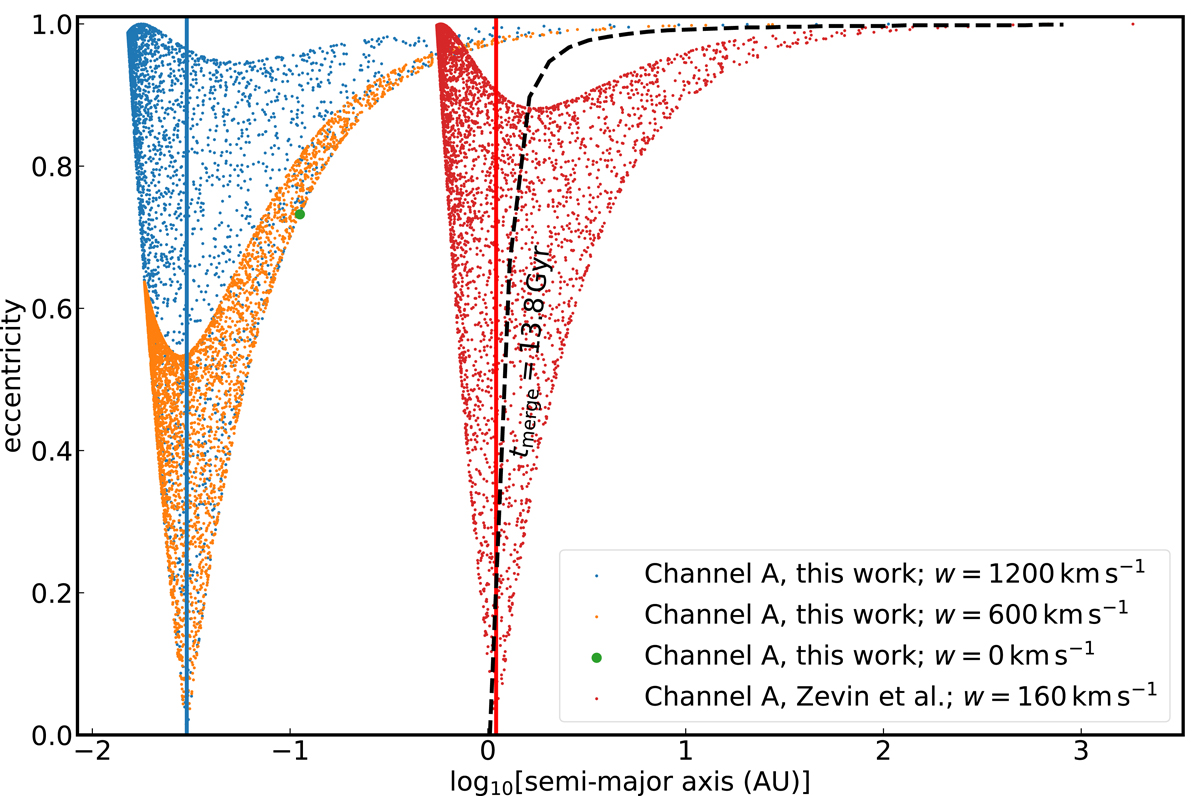
Fig. A.3.
Download original image
Influence of natal SN kicks on the post-SN binary configuration. The scatter plots illustrate the results of a Monte-Carlo simulation for the post-SN distribution of orbital configurations, assuming various initial configurations. Each colour represents a given pre-SN orbit, receiving a kick of fixed amplitude. The kick angles are drawn from uniform distributions (see text and Tauris et al. 2017). Blue, orange, and green points represent the Channel A example discussed in the main text when the second LMG BH is formed. Red points show simulations for the Channel A progenitor discussed in Zevin et al. (2020). Blue and red vertical lines indicate the initial orbital separations of the afforementioned systems. Binaries to the left of the black-dotted line merge within a Hubble time.
Current usage metrics show cumulative count of Article Views (full-text article views including HTML views, PDF and ePub downloads, according to the available data) and Abstracts Views on Vision4Press platform.
Data correspond to usage on the plateform after 2015. The current usage metrics is available 48-96 hours after online publication and is updated daily on week days.
Initial download of the metrics may take a while.