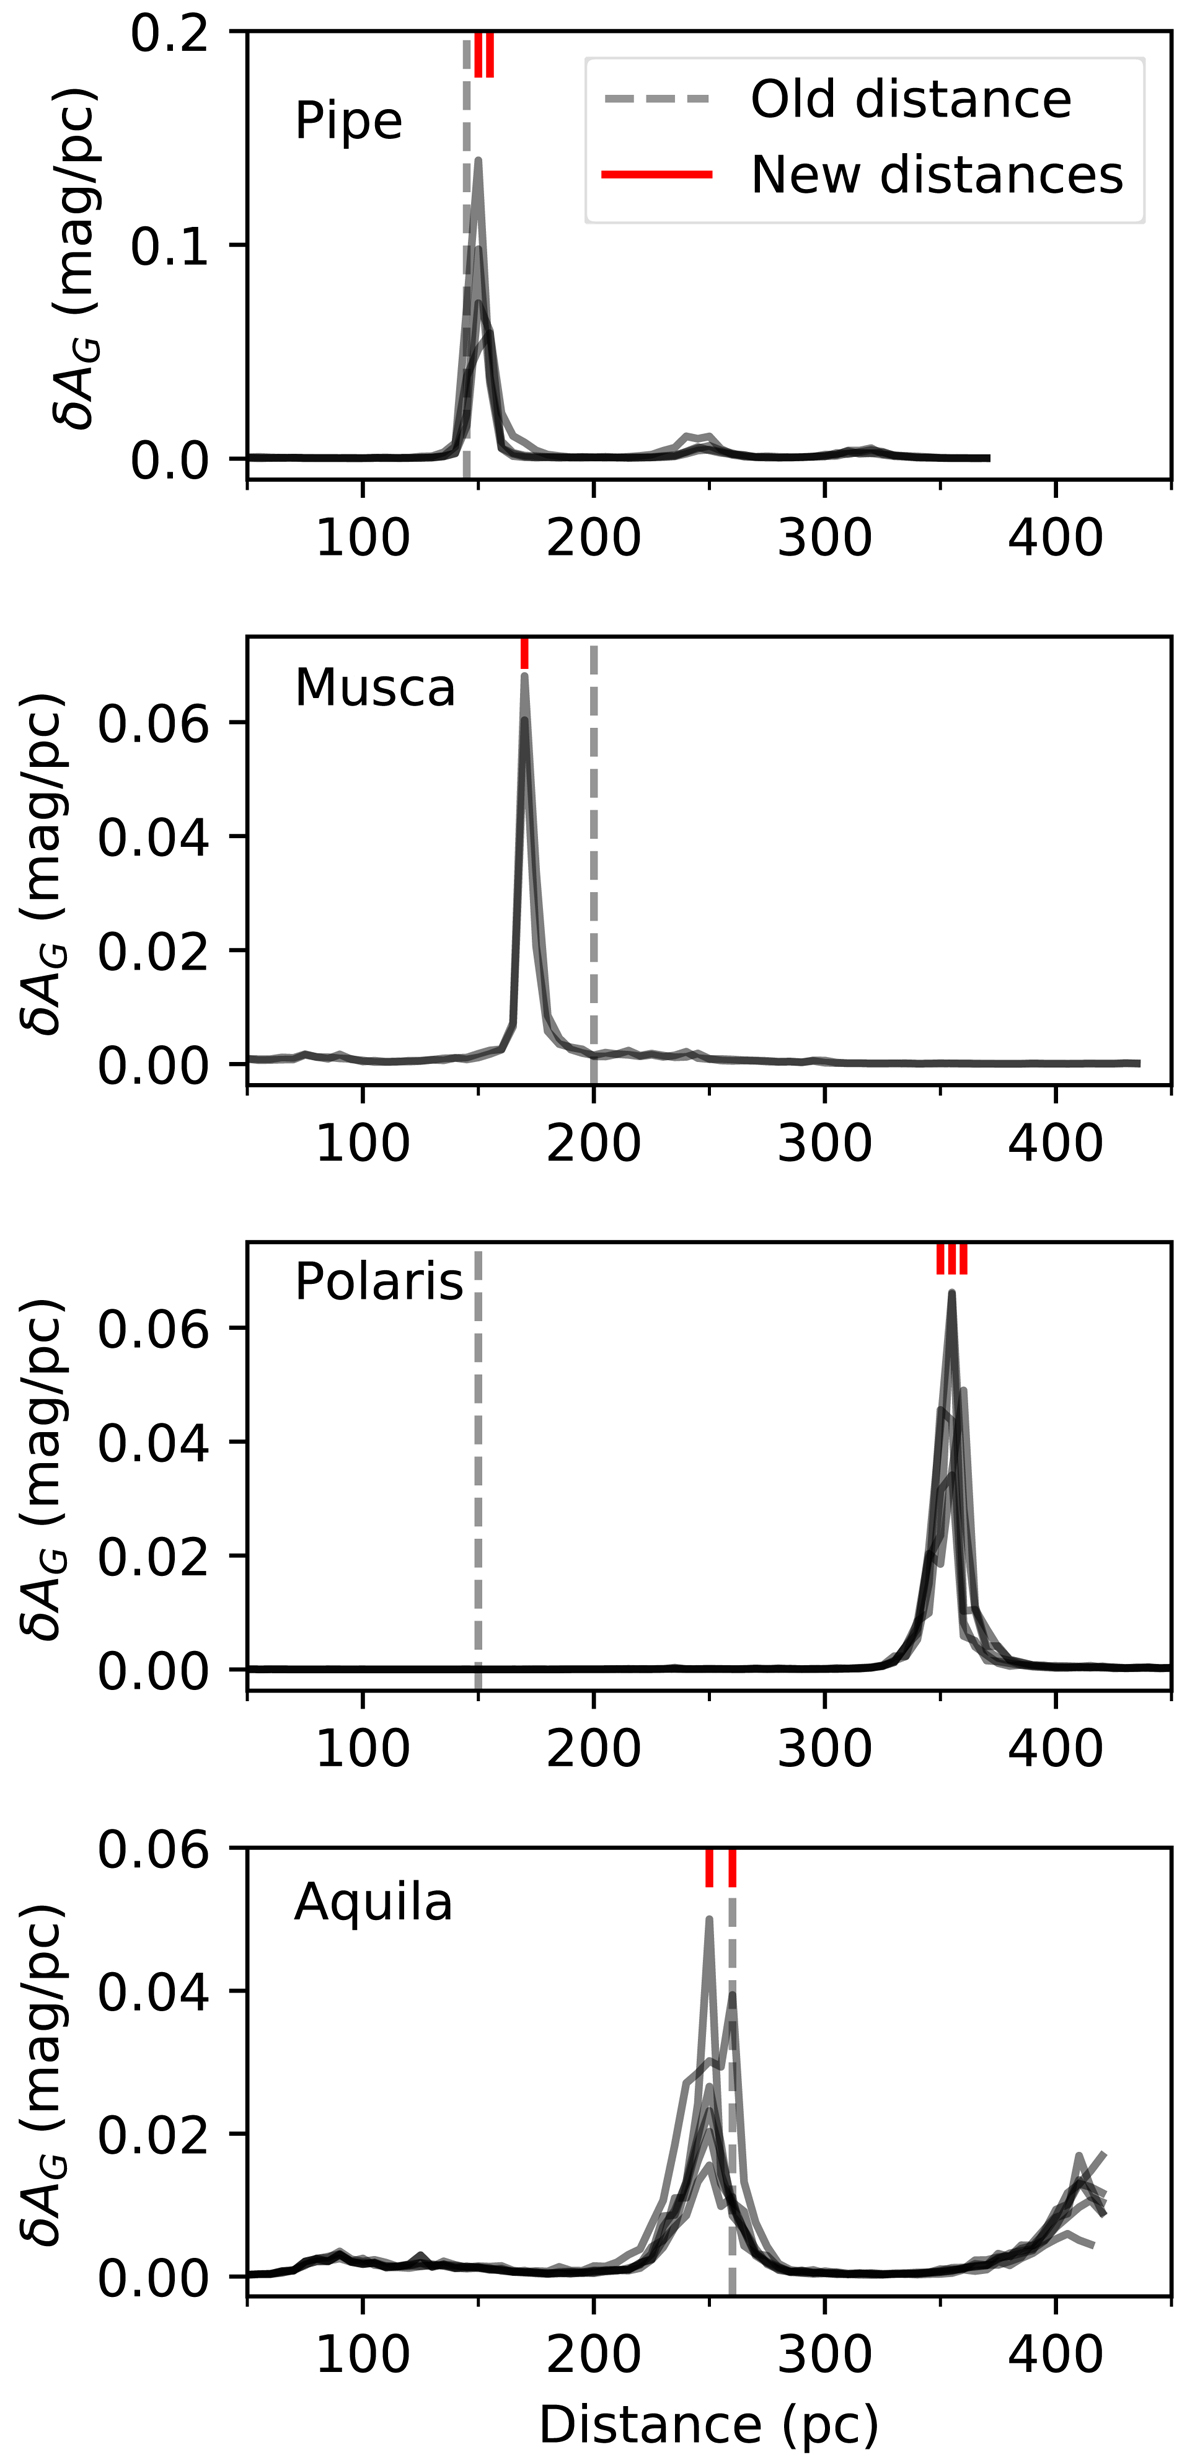
Fig. A.3.
Download original image
Distance determination for the Pipe Nebula, Musca, Polaris Flare, and Aquila Rift clouds. Each subpanel shows the differential G-band extinction per parsec as a function of distance for different sightlines within the Herschel map of each cloud (transparent black lines). Old distance estimates (adopted in Arzoumanian et al. 2019) are shown as a vertical dashed line, while the new distance measurement for each line of sight is shown as a red vertical segment at the top of each panel.
Current usage metrics show cumulative count of Article Views (full-text article views including HTML views, PDF and ePub downloads, according to the available data) and Abstracts Views on Vision4Press platform.
Data correspond to usage on the plateform after 2015. The current usage metrics is available 48-96 hours after online publication and is updated daily on week days.
Initial download of the metrics may take a while.