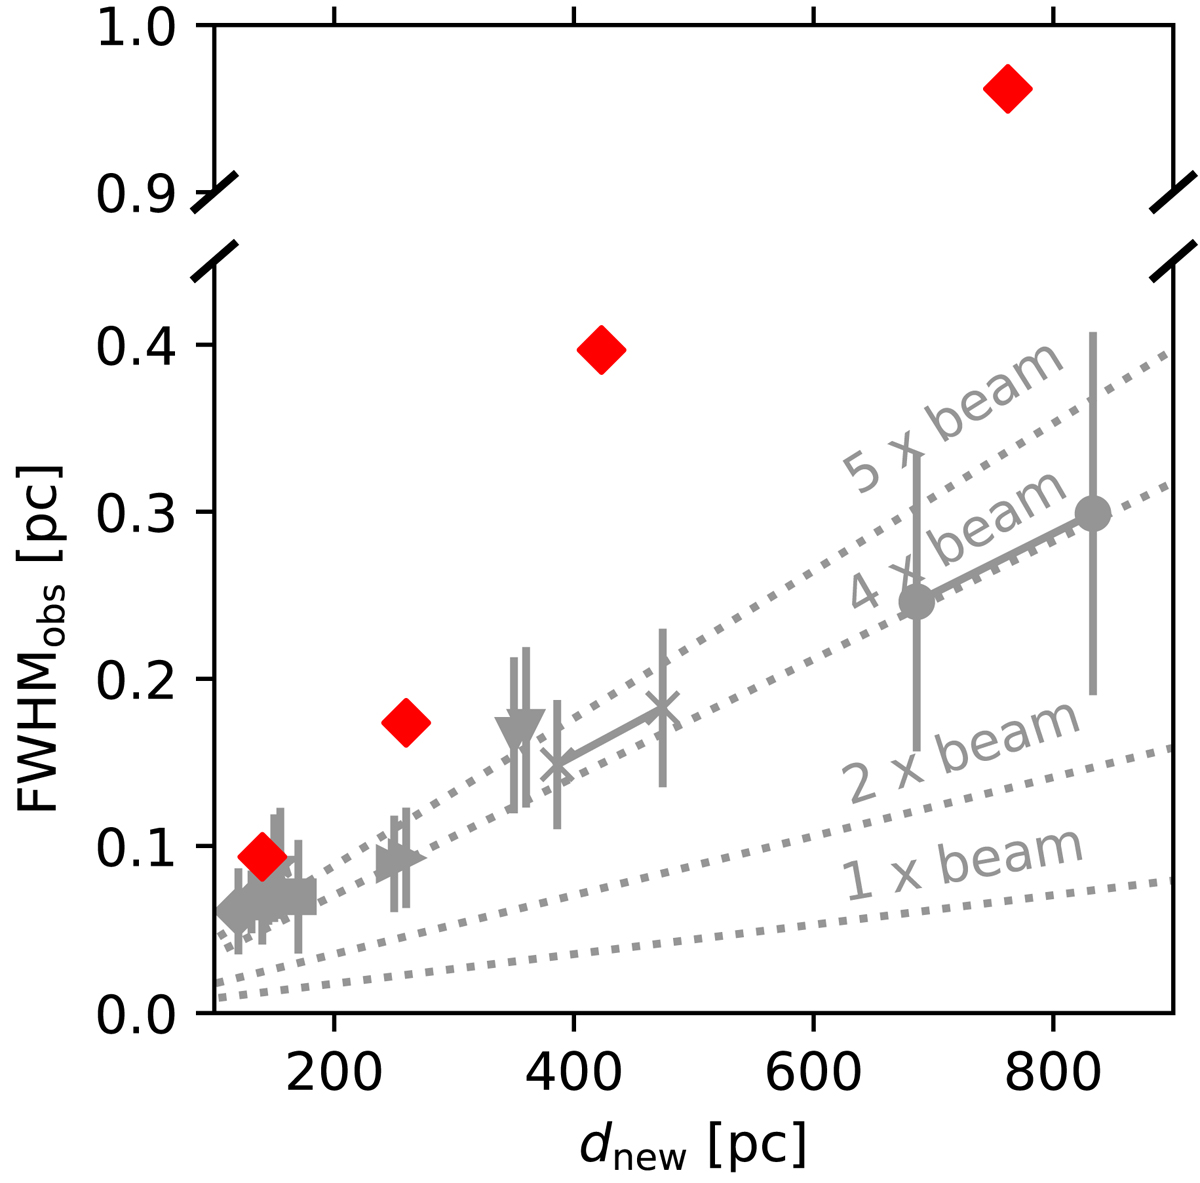
Fig. 2.
Download original image
Comparison between the observed dependence of FWHMobs on the distance (gray data points, symbols as in Fig. 1) and that of a radial profile of a filament in Taurus, after reducing the angular resolution of the Herschel map to correspond to the physical resolution of a 18.2″ beam at the observed cloud distances (red diamonds). Dotted lines mark 1, 2, 4, and 5 times the beam size.
Current usage metrics show cumulative count of Article Views (full-text article views including HTML views, PDF and ePub downloads, according to the available data) and Abstracts Views on Vision4Press platform.
Data correspond to usage on the plateform after 2015. The current usage metrics is available 48-96 hours after online publication and is updated daily on week days.
Initial download of the metrics may take a while.