Fig. 1.
Download original image
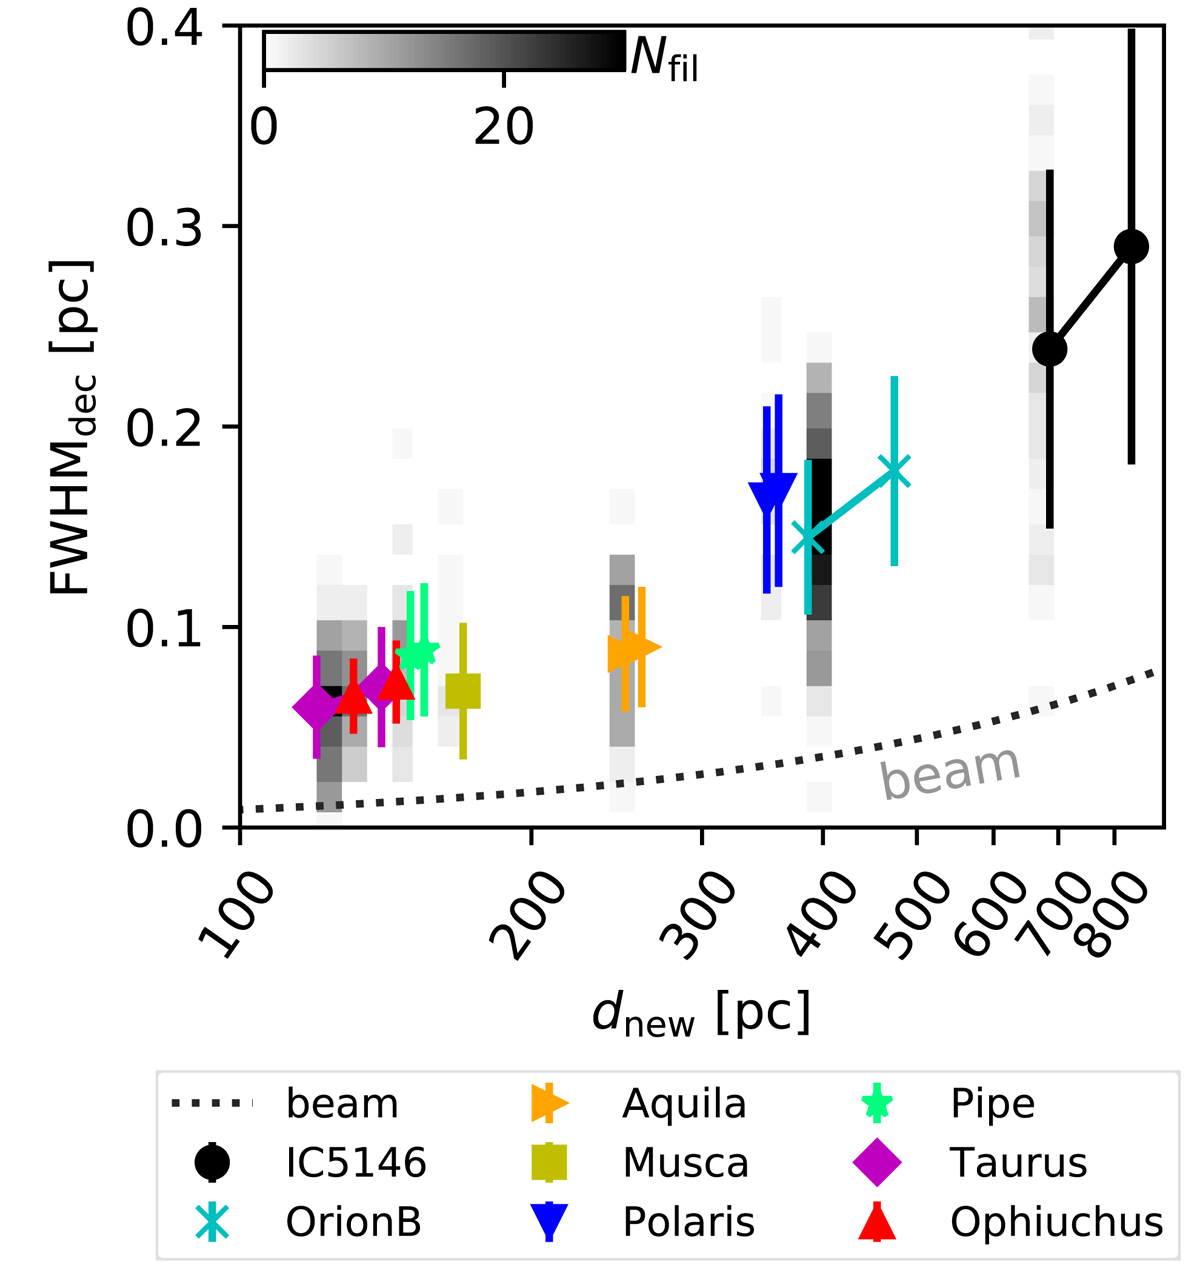
Mean “deconvolved” filament width for each cloud analyzed by Arzoumanian et al. (2019), as a function of the updated cloud distance (dnew). A colored symbol shows the ensemble average width of filaments within a cloud. The vertical lines span the ±1σ range of the distribution of the filament widths of that cloud. Two points mark the full range of distances to a cloud, when such measurements are available. A dotted line shows the Herschel beam size. The background shows a distribution of the filament widths for each cloud, drawn from a Gaussian distribution with the number of measurements per cloud reported in the original study (see text). We only show a realization for the nearest distance limit of each cloud for clarity.
Current usage metrics show cumulative count of Article Views (full-text article views including HTML views, PDF and ePub downloads, according to the available data) and Abstracts Views on Vision4Press platform.
Data correspond to usage on the plateform after 2015. The current usage metrics is available 48-96 hours after online publication and is updated daily on week days.
Initial download of the metrics may take a while.