Fig. 5
Download original image
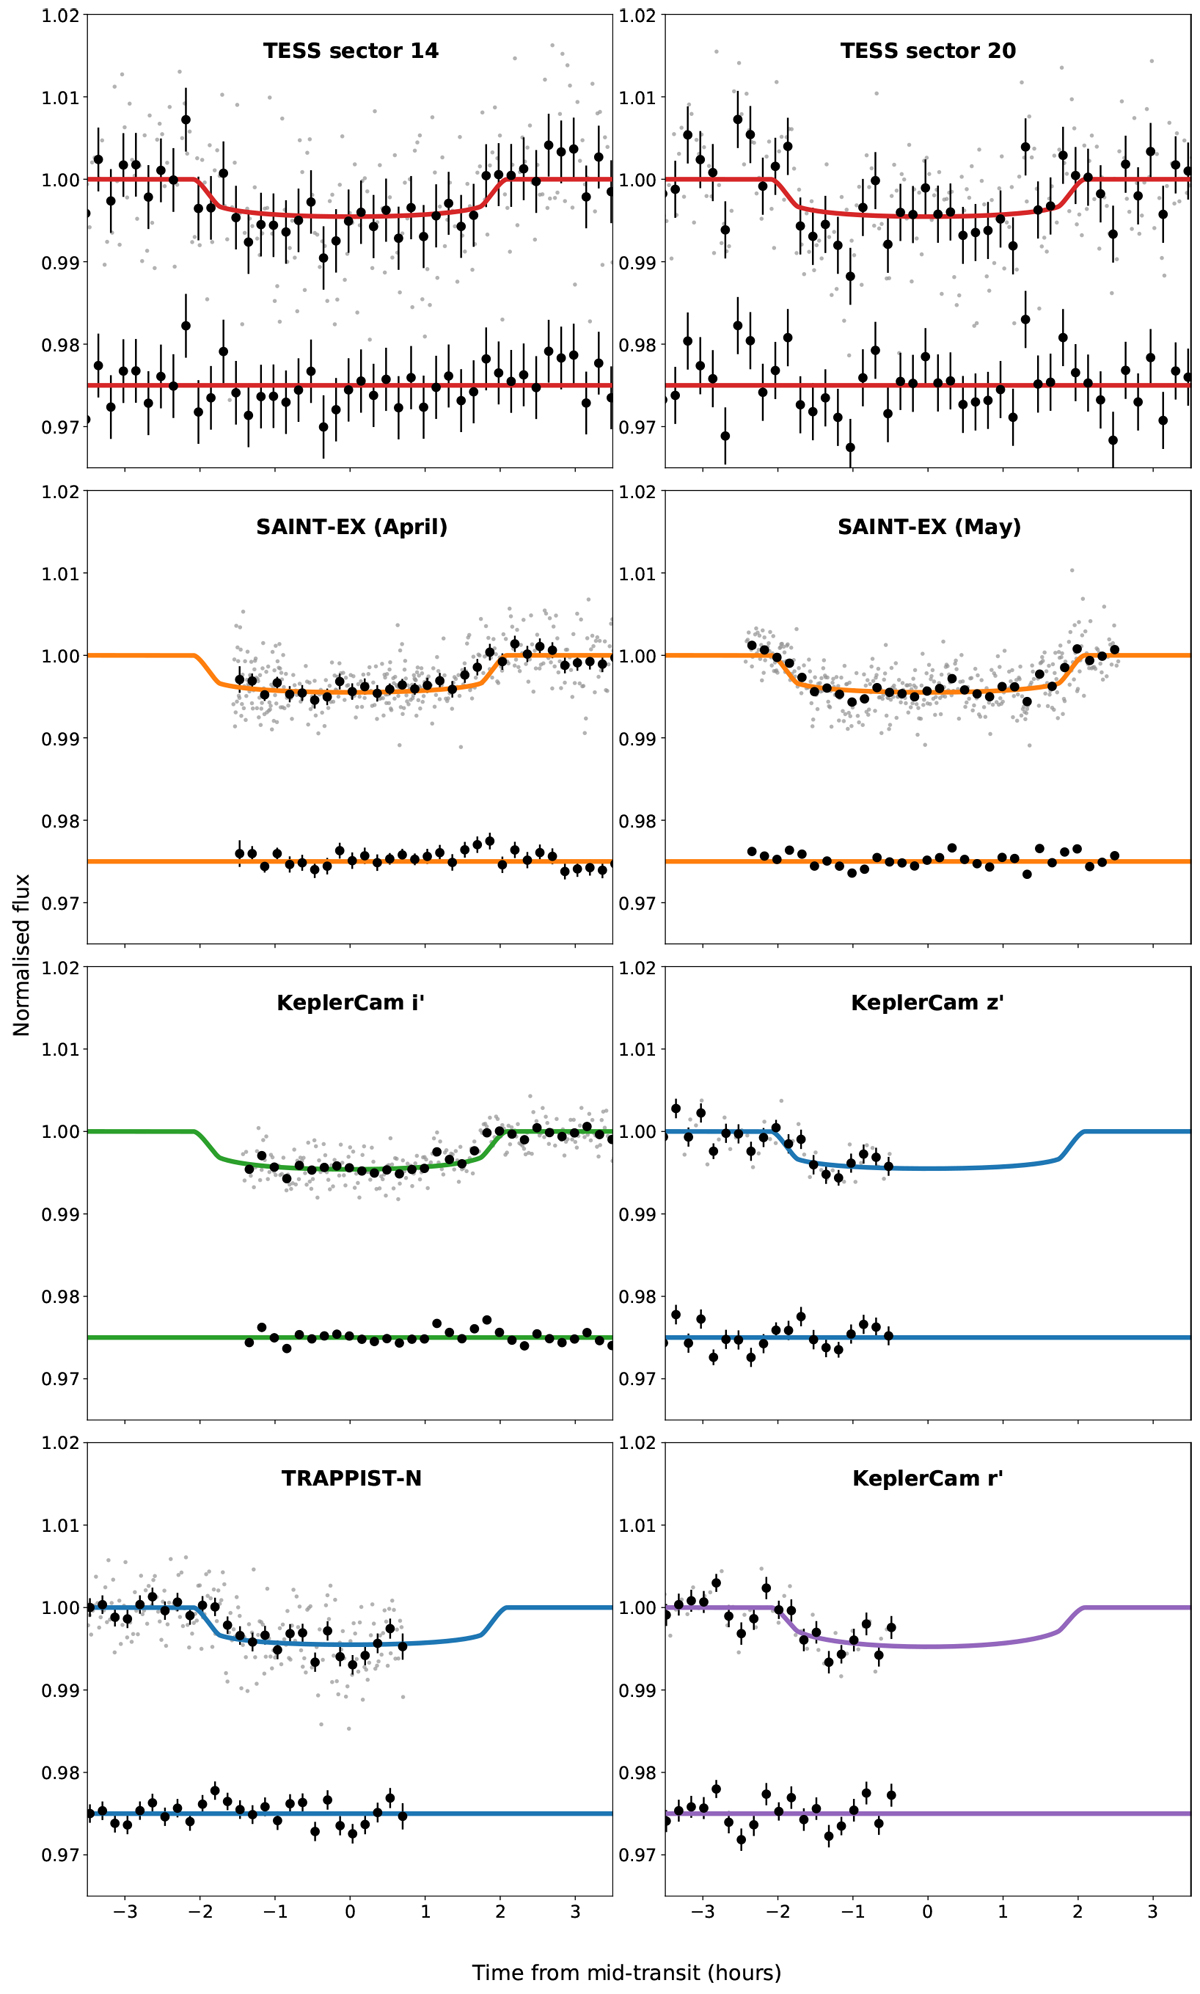
Photometric observations of TOI-2257 with the best-fit transit parameters over-plotted. Thick black points show 10-min bins, with all data points shown in gray. Residuals from the model fit are shown with an arbitrary offset below the transit. It should be noted that, for the sake of clarity, only 10-min-binned residuals are shown. The color of the line reflects the filter used for the observations (red for TESS, orange for I+z, green for i’, blue for z’, and purple for r’).
Current usage metrics show cumulative count of Article Views (full-text article views including HTML views, PDF and ePub downloads, according to the available data) and Abstracts Views on Vision4Press platform.
Data correspond to usage on the plateform after 2015. The current usage metrics is available 48-96 hours after online publication and is updated daily on week days.
Initial download of the metrics may take a while.