Free Access
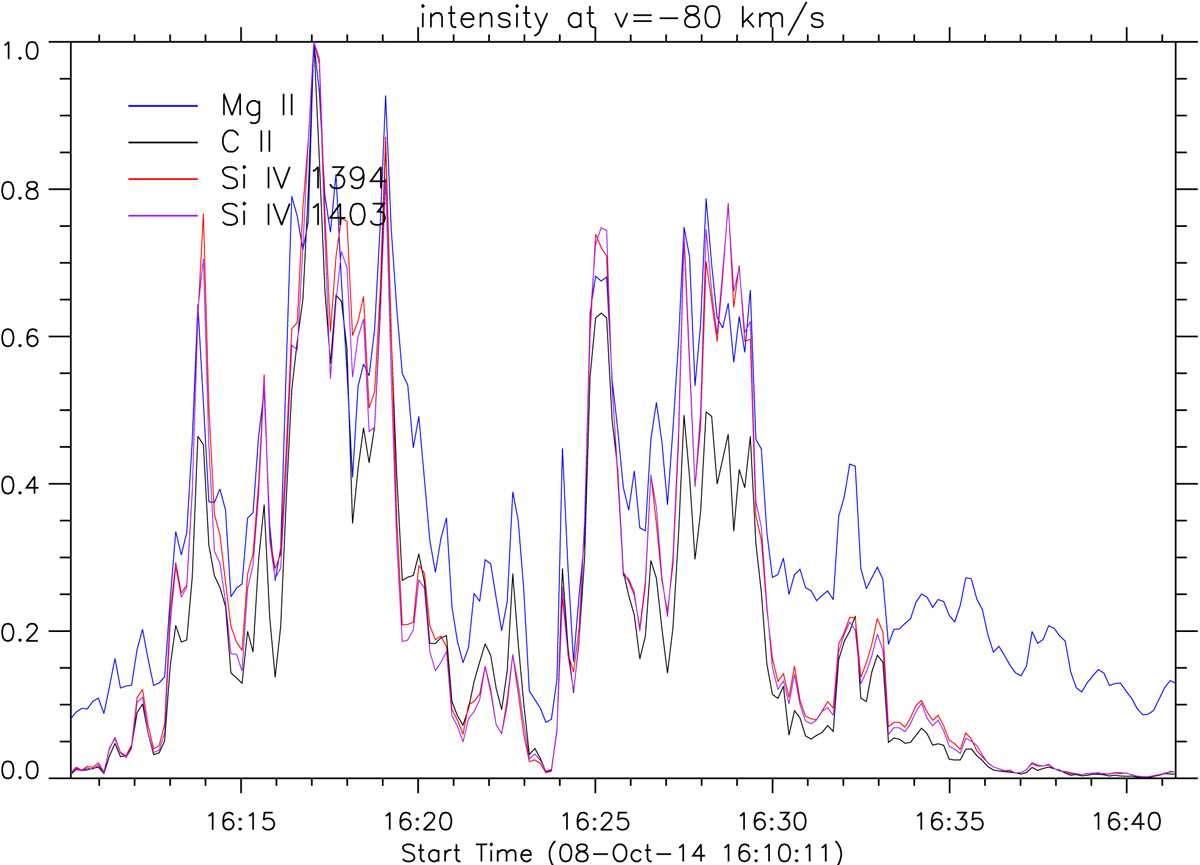
Fig. 9.
Download original image
Example of (normalized) intensity evolution at v = −80 km s−1 of a burst showing that both the IB and the higher atmospheric burst occur simultaneously in all spectral lines. This is a typical behavior.
Current usage metrics show cumulative count of Article Views (full-text article views including HTML views, PDF and ePub downloads, according to the available data) and Abstracts Views on Vision4Press platform.
Data correspond to usage on the plateform after 2015. The current usage metrics is available 48-96 hours after online publication and is updated daily on week days.
Initial download of the metrics may take a while.