Fig. 8.
Download original image
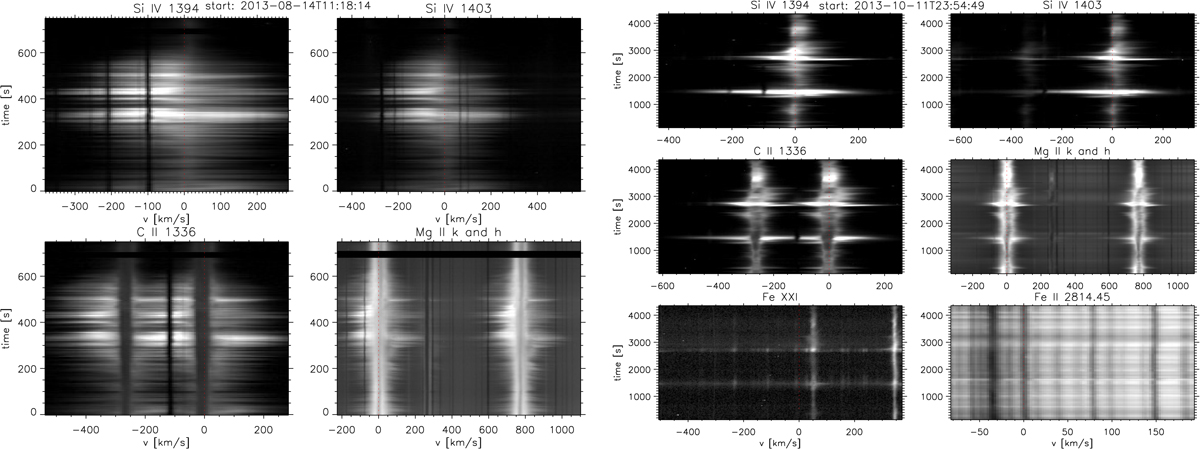
Examples of temporal evolutions of bursts. The horizontal axis is labeled in Doppler velocities, while the vertical axis is given in seconds. Left: observation on Aug. 14, 2013, showing recurring bursts, visible in all spectral lines with absorption line blends. Right: observation on Oct. 11, 2013, showing that the first burst is an IB, while the second burst (∼20 min later) seems to occur higher in the atmosphere and thus has no absorption blend lines.
Current usage metrics show cumulative count of Article Views (full-text article views including HTML views, PDF and ePub downloads, according to the available data) and Abstracts Views on Vision4Press platform.
Data correspond to usage on the plateform after 2015. The current usage metrics is available 48-96 hours after online publication and is updated daily on week days.
Initial download of the metrics may take a while.