Free Access
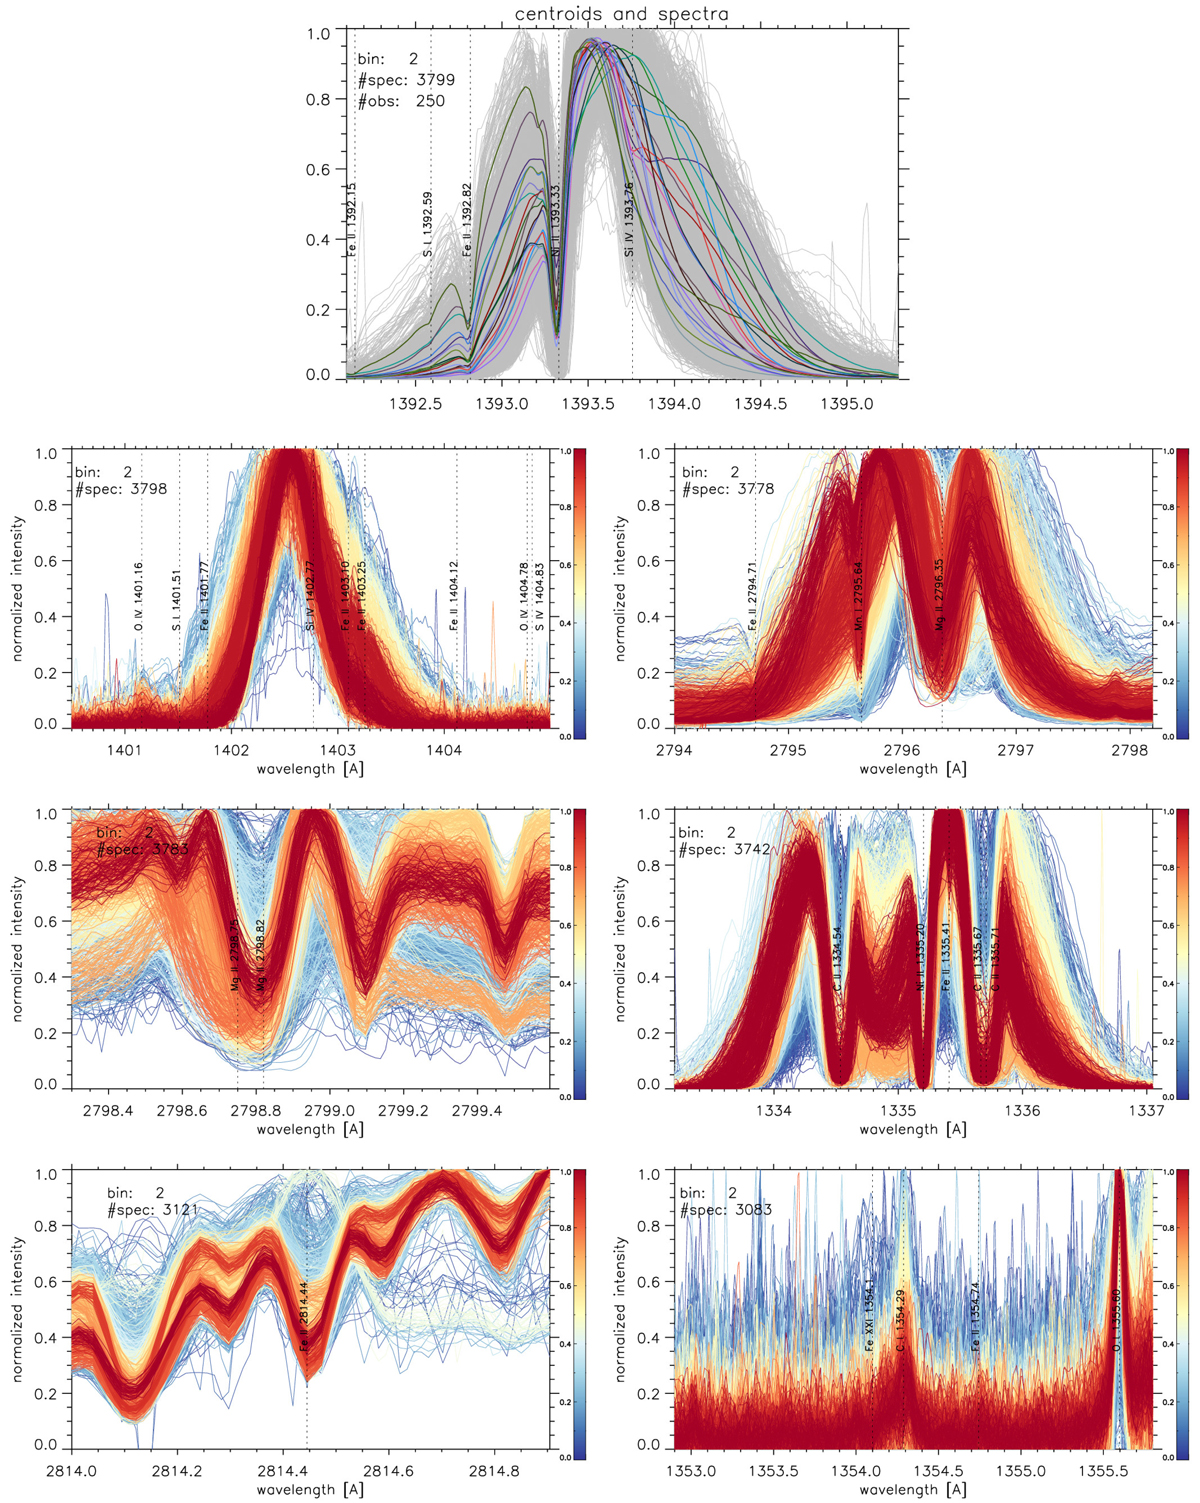
Fig. 4.
Download original image
Some of the deepest absorption line blends observed in burst spectra. Top panel: indicates which Si IV 1393.76 spectra were selected (gray) and their centroids (colored). Lower panels: co-occurring spectra, color-coded by probability, red being the most probable.
Current usage metrics show cumulative count of Article Views (full-text article views including HTML views, PDF and ePub downloads, according to the available data) and Abstracts Views on Vision4Press platform.
Data correspond to usage on the plateform after 2015. The current usage metrics is available 48-96 hours after online publication and is updated daily on week days.
Initial download of the metrics may take a while.