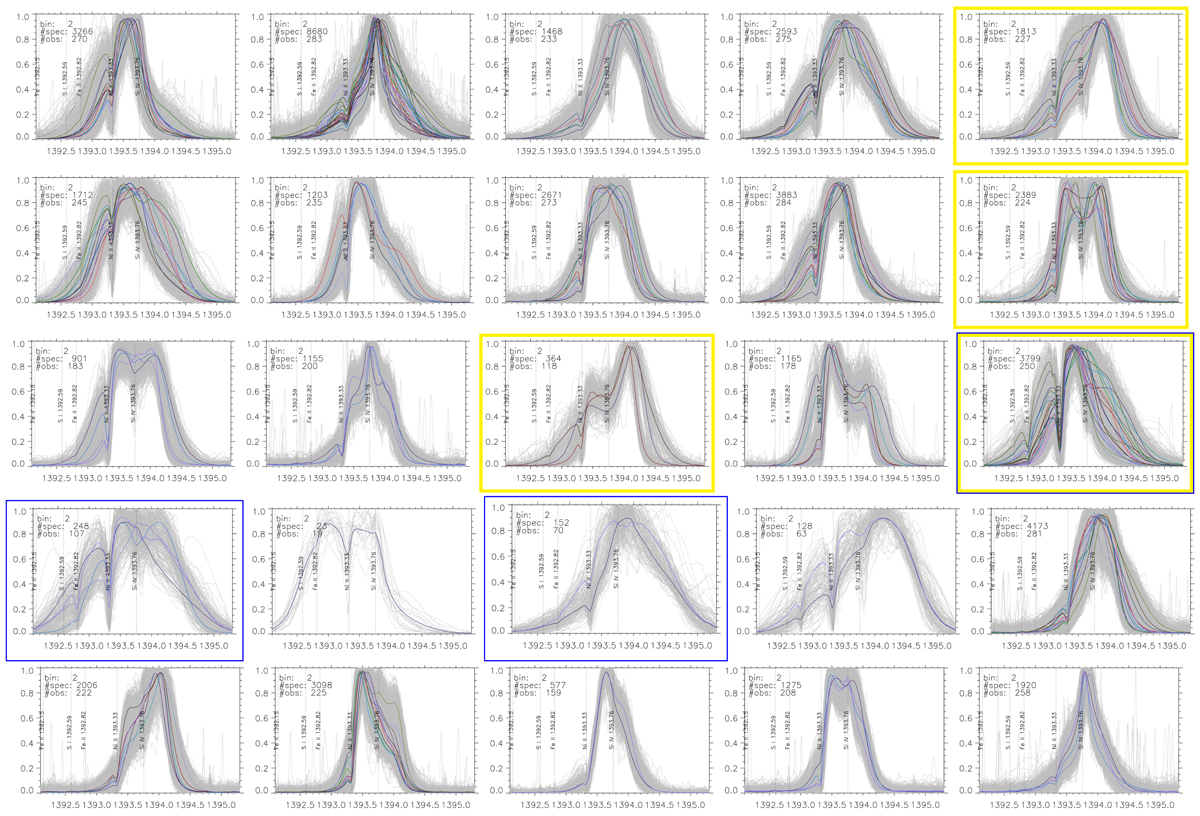
Fig. 3.
Download original image
Overview of Si IV burst spectra (gray) and k-means centroids (colored) that were identified in all observations from 2013 to 2014. Positions of blend lines are drawn as vertical dotted lines. #spec indicates how many spectra are drawn in a given panel for a given binning (“bin”) and #obs indicates in how many of the 287 observations a given type occurred. The yellow-framed burst spectra are analyzed in more detail in Sect. 3.1 and those framed in blue in Sect. 3.2.
Current usage metrics show cumulative count of Article Views (full-text article views including HTML views, PDF and ePub downloads, according to the available data) and Abstracts Views on Vision4Press platform.
Data correspond to usage on the plateform after 2015. The current usage metrics is available 48-96 hours after online publication and is updated daily on week days.
Initial download of the metrics may take a while.