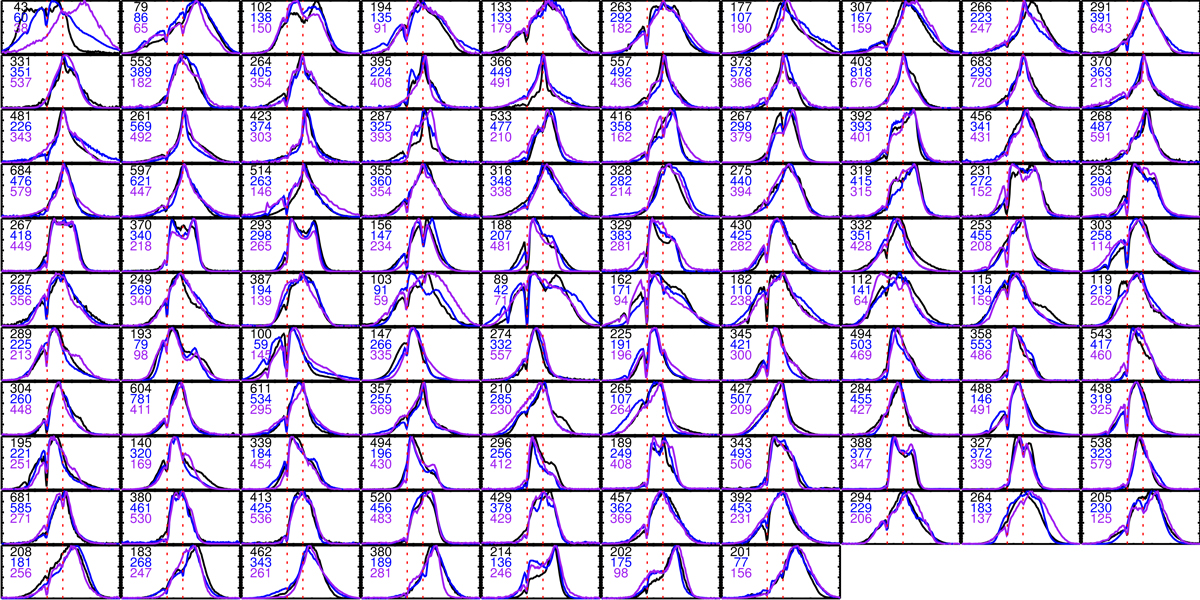
Fig. 2.
Download original image
321 Si IV “centroids” (or rather median spectra) depicting the different spectral shapes that were found for IBs. Three spectra are plotted in different colors in each panel to save space, but during the classification, all of them were treated independently. The numbers indicate how many spectra were classified into a given centroid. The red dotted lines indicate the wavelengths of line center and of the Ni II blend at 1393.33 Å.
Current usage metrics show cumulative count of Article Views (full-text article views including HTML views, PDF and ePub downloads, according to the available data) and Abstracts Views on Vision4Press platform.
Data correspond to usage on the plateform after 2015. The current usage metrics is available 48-96 hours after online publication and is updated daily on week days.
Initial download of the metrics may take a while.