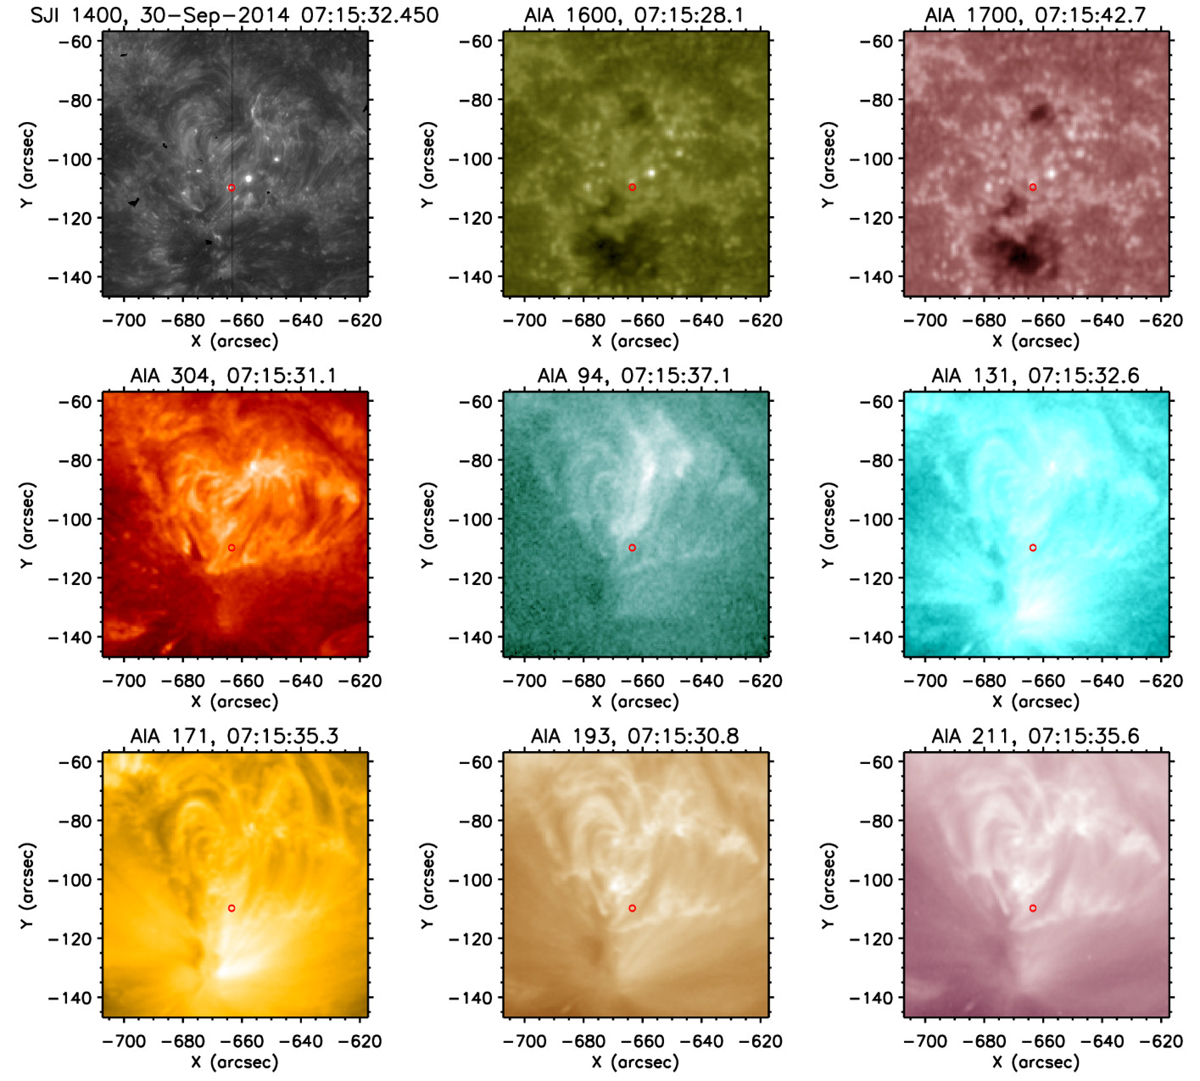
Fig. 11.
Download original image
Example of locations of IBs (red circles). Co-spatial brightenings are visible in IRIS SJI, AIA 1600 and AIA 1700, while other AIA wavelengths do not seem to show any response to bursts. Because bursts were identified based on spectra, the red circles are always located close to the slit (vertical black line in SJI 1400). It is well possible that other brightenings in the SJI or AIA images also correspond to bursts, but that simply no spectra were available to identify them. An animation of this figure is available online.
Current usage metrics show cumulative count of Article Views (full-text article views including HTML views, PDF and ePub downloads, according to the available data) and Abstracts Views on Vision4Press platform.
Data correspond to usage on the plateform after 2015. The current usage metrics is available 48-96 hours after online publication and is updated daily on week days.
Initial download of the metrics may take a while.