Fig. A.1
Download original image
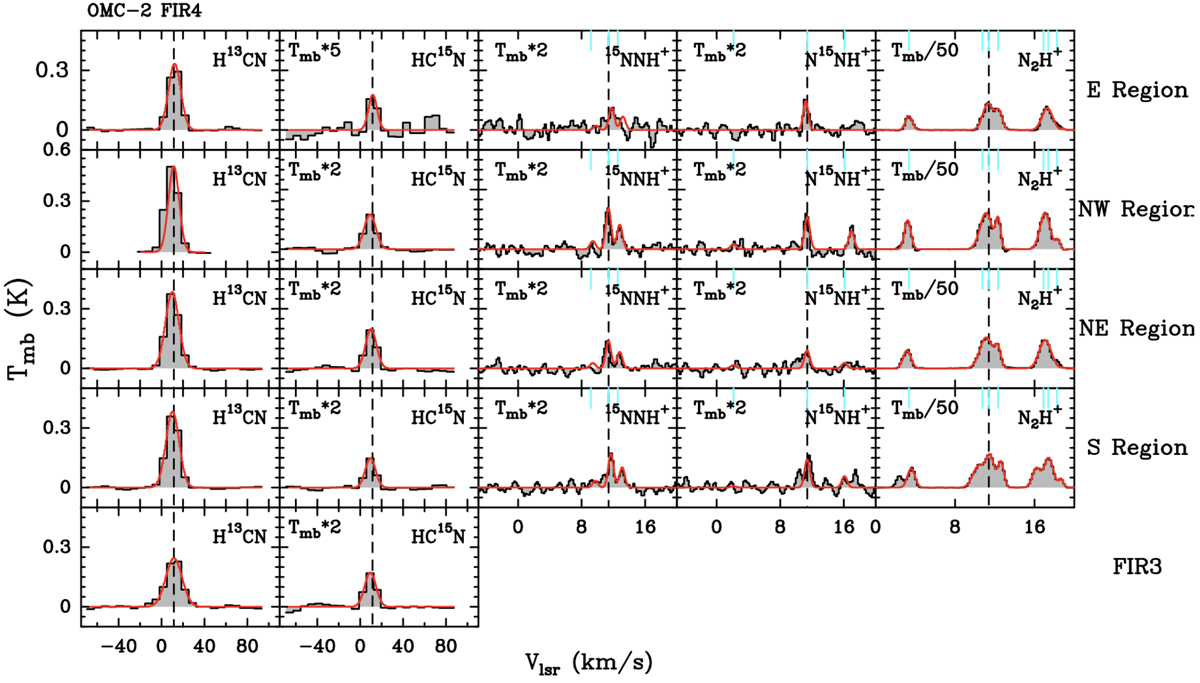
Spectra extracted for our study in (left to right) H13CN (1 − 0), HC15N (1 − 0), 15NNH+ (1 − 0), N15NH+ (1 − 0) and N2H+ (1 − 0); from top to bottom, the spectra extracted in the E, NW, NE, S and FIR3 regions. The CASSIS fits are superimposed in red. The dashed black line represents the VLSR value for thissource, which is 11.4 km s−1. The blue lines represent the location of the HFS components for N2H+ and its 15N isotopologues.
Current usage metrics show cumulative count of Article Views (full-text article views including HTML views, PDF and ePub downloads, according to the available data) and Abstracts Views on Vision4Press platform.
Data correspond to usage on the plateform after 2015. The current usage metrics is available 48-96 hours after online publication and is updated daily on week days.
Initial download of the metrics may take a while.