| Issue |
A&A
Volume 671, March 2023
|
|
|---|---|---|
| Article Number | C4 | |
| Number of page(s) | 2 | |
| Section | Interstellar and circumstellar matter | |
| DOI | https://doi.org/10.1051/0004-6361/202142147e | |
| Published online | 08 March 2023 | |
SOLIS
XIII. Nitrogen fractionation towards the protocluster OMC-2 FIR4★ (Corrigendum)
1
IRAP, Université de Toulouse,
9 avenue du colonel Roche,
31028
Toulouse Cedex 4, France
e-mail: phyle@leeds.ac.uk
2
INAF, Osservatorio Astrofísico di Arcetri,
Largo E. Fermi 5,
50125
Firenze, Italy
3
Univ. Grenoble Alpes, CNRS, Institut de Planetologie et d’Astrophysique de Grenoble (IPAG),
38000
Grenoble, France
4
Max-Planck-Institut für extraterrestrische Physik (MPE),
Giessenbachstrasse 1,
85748
Garching, Germany
5
Institut de Radioastronomie Millimetrique (IRAM),
300 rue de la Piscine, Domaine Universitaire de Grenoble,
38406
Saint-Martin d’Hères, France
6
Ecole doctorale de Physique, Université Grenoble Alpes,
110 Rue de la Chimie,
38400
Saint-Martin-d’Hères, France
Key words: stars: formation / ISM: clouds / ISM: molecules / errata, addenda
In the published article, Fig. 6 and Table 2 contain erroneous values. These errors only affect Cols. 3 and 5 of Table 2 and the values indicated in blue in Fig. 6. As a result, the values of the optical depths stated in the first sentence of Sect. 4.2 of the published article should range between 9.0×10⁻⁴ and 1.4×10⁻² instead of the originally published range of 8.1×10⁻⁴ to 1.6×10⁻². However, they do not affect any other parameters indicated in the paper, nor do they affect any of the conclusions. The correct figure and table are provided below. We apologise for any confusion caused by these erroneous values.
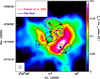 |
Fig. 6 Combined 14N/15 N ratios in N2H+ in regions defined by Fontani et al. (2020) (red) and in regions defined by our work (blue) overlaid onto N2H+ (1–0) emission from Fontani et al. (2020) (colour scale), with the blue values representing the average of those presented in Table 5; red triangles show locations of continuum emission sources in FIR4 as identified by Neri et al. (in prep.). The wedge on the right indicates the range of flux density (Jy beam−1). The ellipse in the bottom-left corner represents the ALMA synthesised beam. |
Values for the parameters used in Eqs. (7) and (8), plus those varied during MCMC modelling for N2H+ and its 15N isotopologues.
References
- Fontani, F., Quaia, G., Ceccarelli, C., et al. 2020, MNRAS, 493, 3412 [NASA ADS] [CrossRef] [Google Scholar]
© The Authors 2023
 Open Access article, published by EDP Sciences, under the terms of the Creative Commons Attribution License (https://creativecommons.org/licenses/by/4.0), which permits unrestricted use, distribution, and reproduction in any medium, provided the original work is properly cited.
This article is published in open access under the Subscribe to Open model. Subscribe to A&A to support open access publication.
All Tables
Values for the parameters used in Eqs. (7) and (8), plus those varied during MCMC modelling for N2H+ and its 15N isotopologues.
All Figures
|
Fig. 6 Combined 14N/15 N ratios in N2H+ in regions defined by Fontani et al. (2020) (red) and in regions defined by our work (blue) overlaid onto N2H+ (1–0) emission from Fontani et al. (2020) (colour scale), with the blue values representing the average of those presented in Table 5; red triangles show locations of continuum emission sources in FIR4 as identified by Neri et al. (in prep.). The wedge on the right indicates the range of flux density (Jy beam−1). The ellipse in the bottom-left corner represents the ALMA synthesised beam. |
| In the text | |
Current usage metrics show cumulative count of Article Views (full-text article views including HTML views, PDF and ePub downloads, according to the available data) and Abstracts Views on Vision4Press platform.
Data correspond to usage on the plateform after 2015. The current usage metrics is available 48-96 hours after online publication and is updated daily on week days.
Initial download of the metrics may take a while.