Fig. 4
Download original image
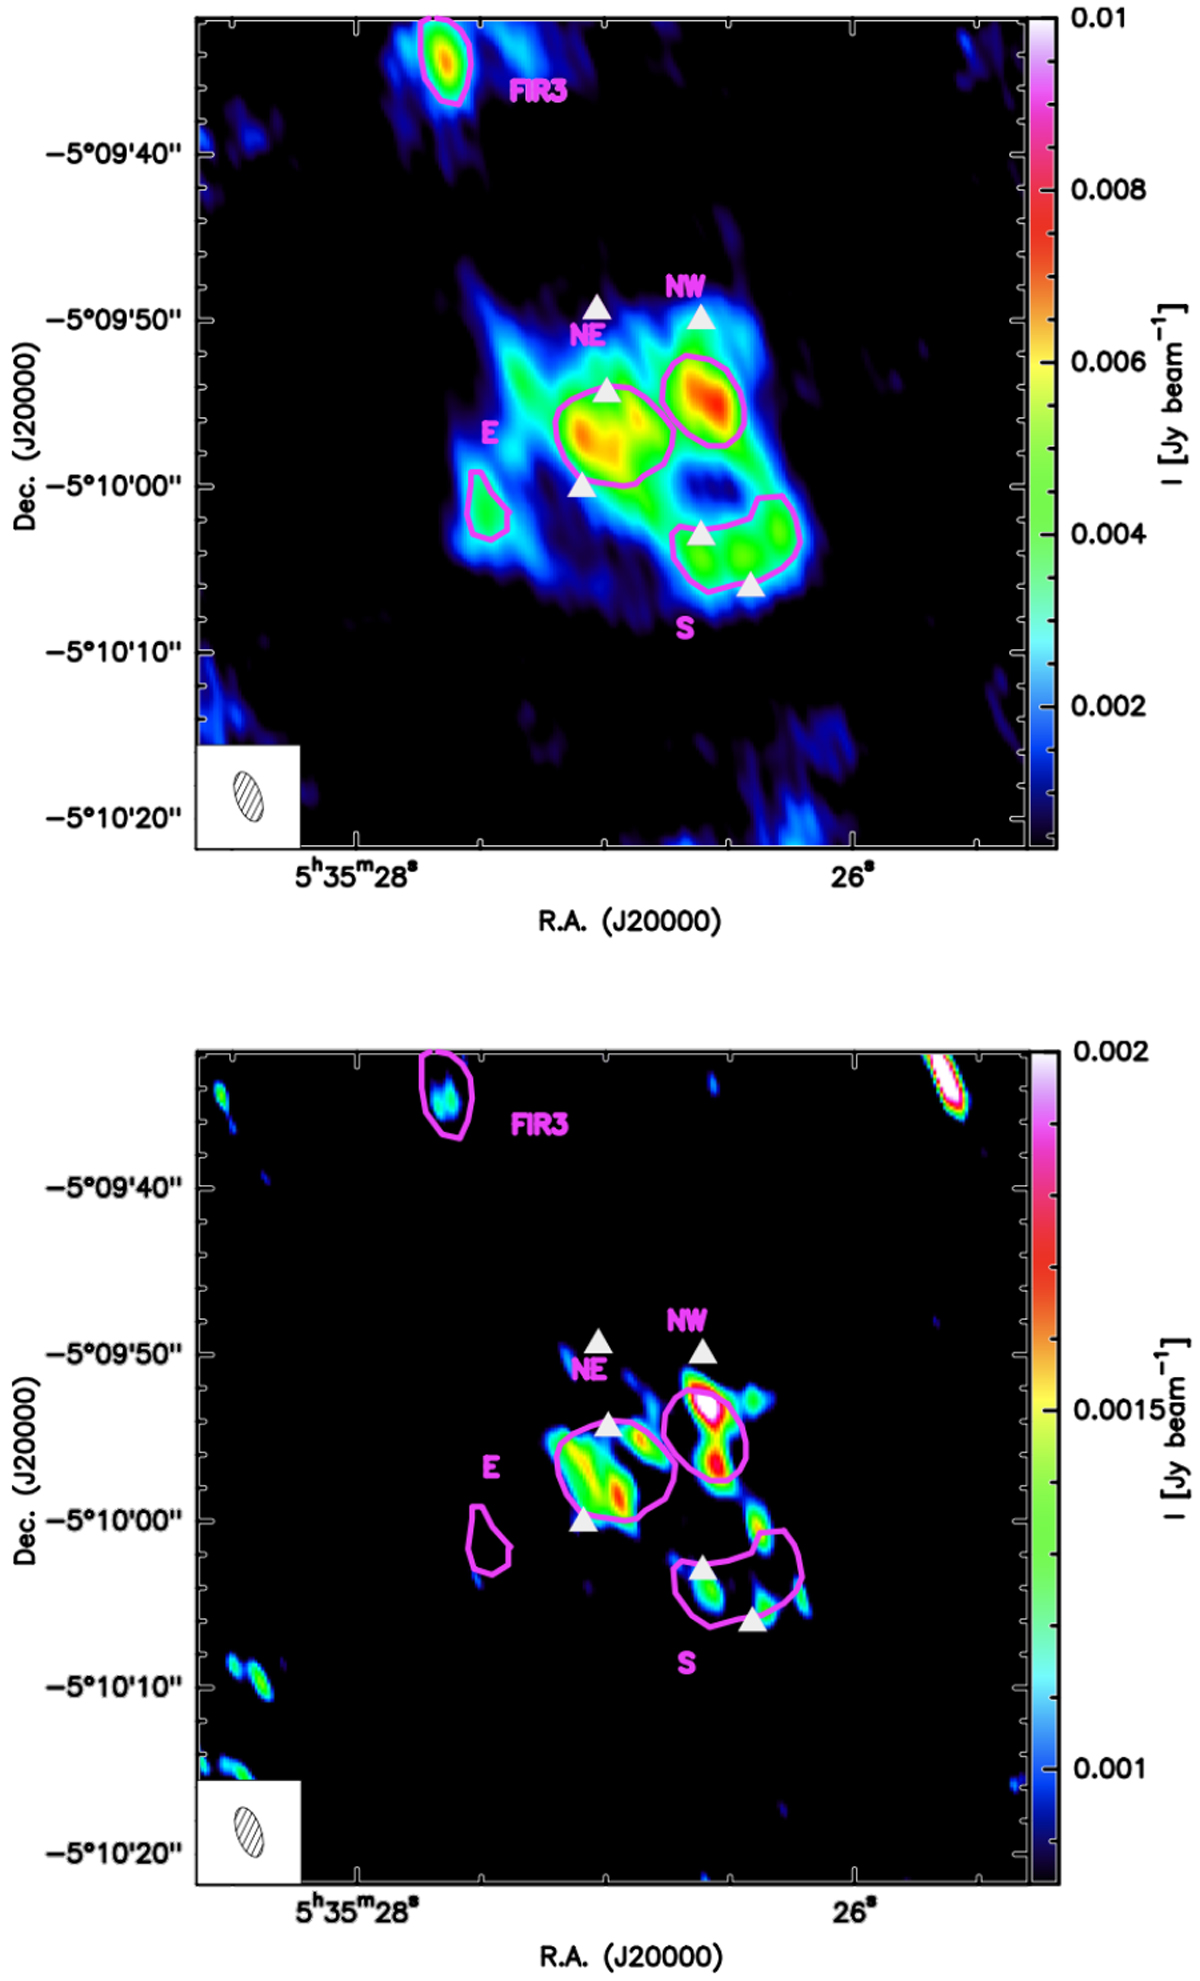
Upper panel: H13CN (1−0) average emission map with extraction regions enclosed by pink curves. Lower panel: HC15N (1−0) average emission map with extraction regions enclosed by pink curves. The wedge on the right of each panel indicates the range of flux density (Jy beam−1). The ellipse in the bottom-left corner of each panel represents the NOEMA synthesised beam. White triangles mark the positions of continuum sources as identified by Neri et al. (in prep.).
Current usage metrics show cumulative count of Article Views (full-text article views including HTML views, PDF and ePub downloads, according to the available data) and Abstracts Views on Vision4Press platform.
Data correspond to usage on the plateform after 2015. The current usage metrics is available 48-96 hours after online publication and is updated daily on week days.
Initial download of the metrics may take a while.