Fig. 2
Download original image
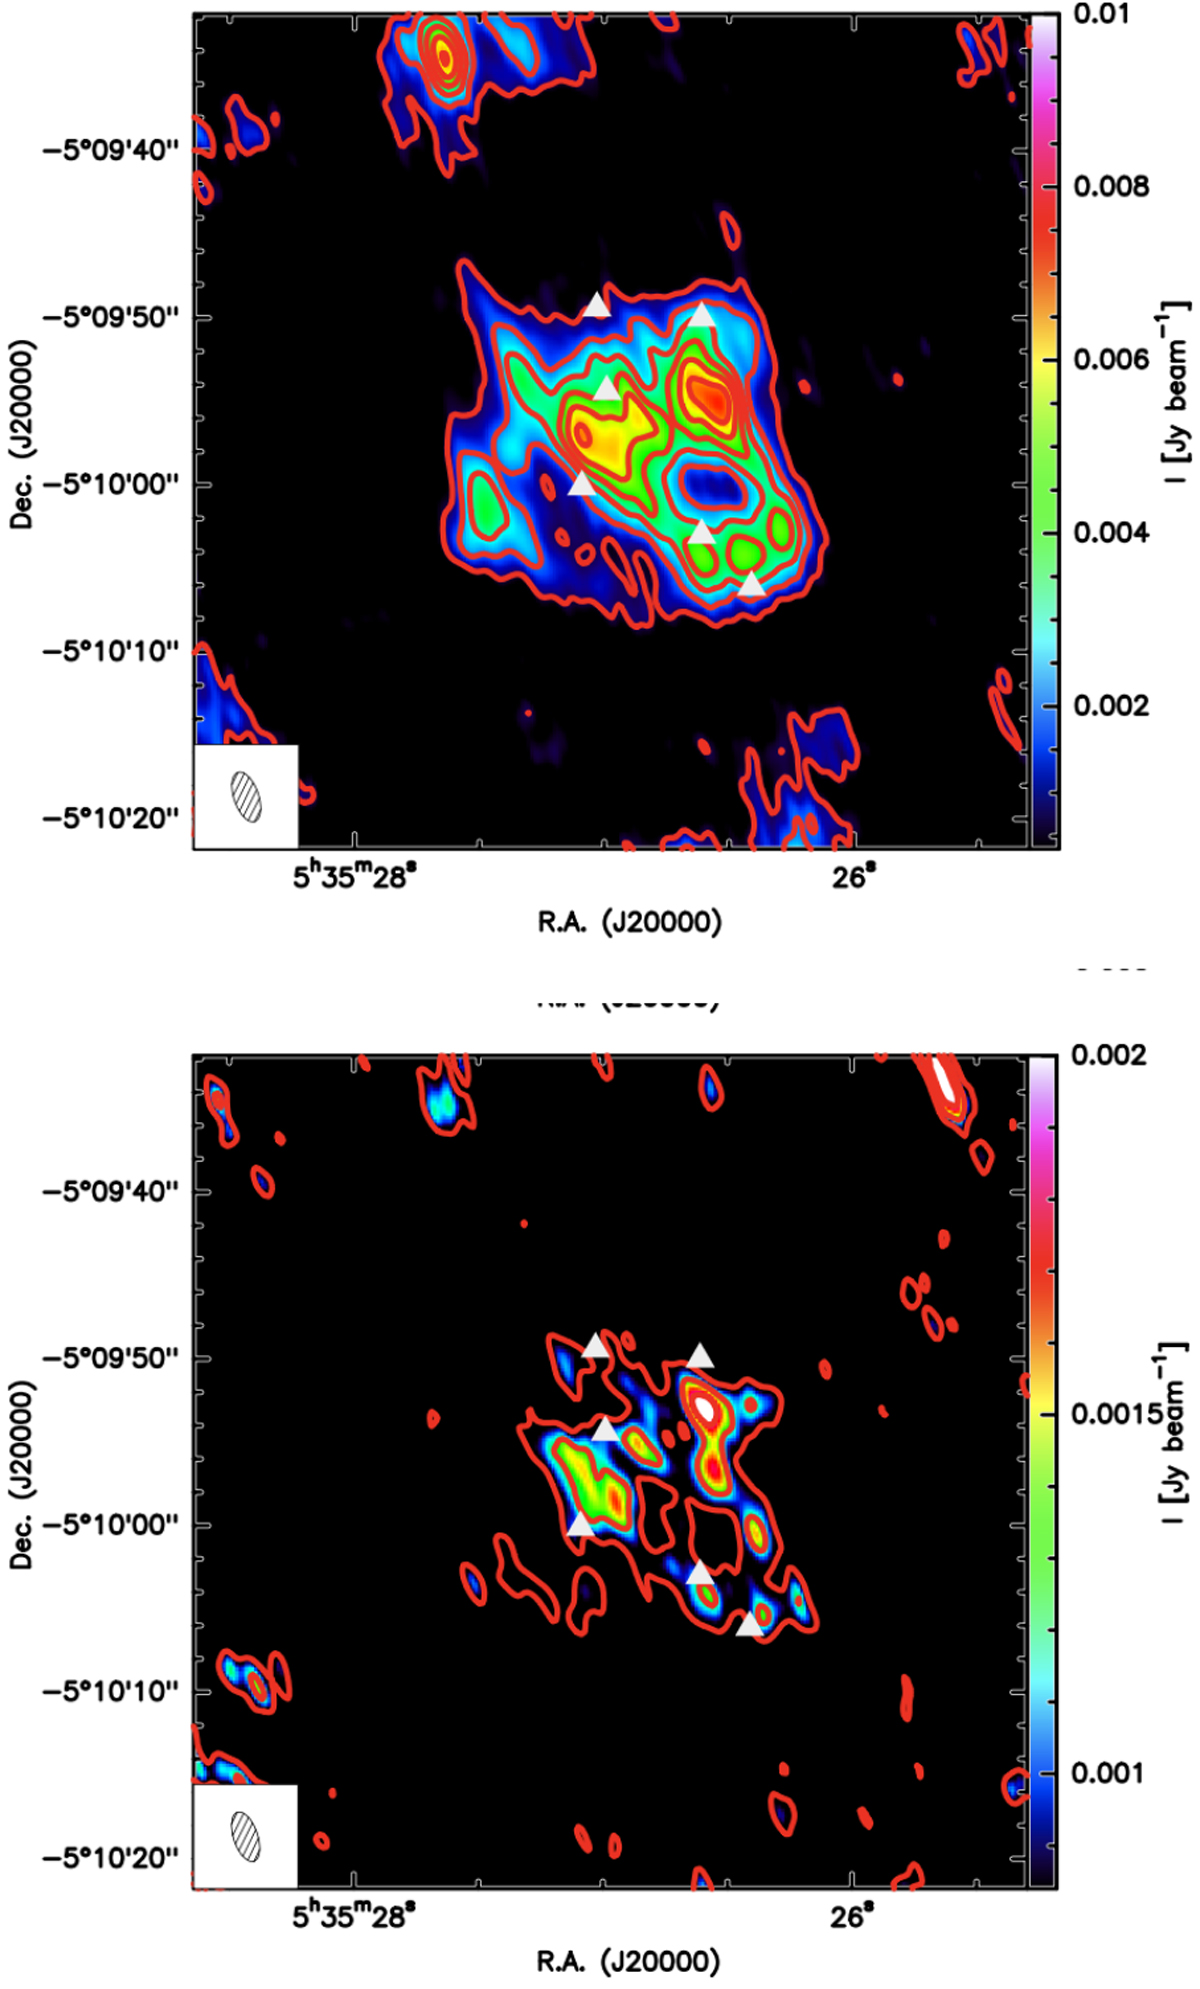
Upper panel: H13CN (1−0) average emission map in colour scale and red contours. Contours start at the level of 4σ, corresponding to 0.70 mJy beam−1 (1σ = 0.18 mJy beam−1) and are in intervals of 6σ, corresponding to 1.17 mJy beam−1. Lower panel:HC15N (1−0) average emission map in colour scale and red contours. Contours start at the level of 4σ, corresponding to 0.84 mJy beam−1 (1σ = 0.21 mJy beam−1) and are in levels of 4σ, corresponding to 0.84 mJy beam−1. Continuum sources identified by Neri et al. (in prep.) are marked by white triangles. The wedge on the right indicates the range of flux density (Jy beam−1). The ellipse in the bottom-left corner of each panel represents the NOEMA synthesised beam.
Current usage metrics show cumulative count of Article Views (full-text article views including HTML views, PDF and ePub downloads, according to the available data) and Abstracts Views on Vision4Press platform.
Data correspond to usage on the plateform after 2015. The current usage metrics is available 48-96 hours after online publication and is updated daily on week days.
Initial download of the metrics may take a while.