Fig. 6.
Download original image
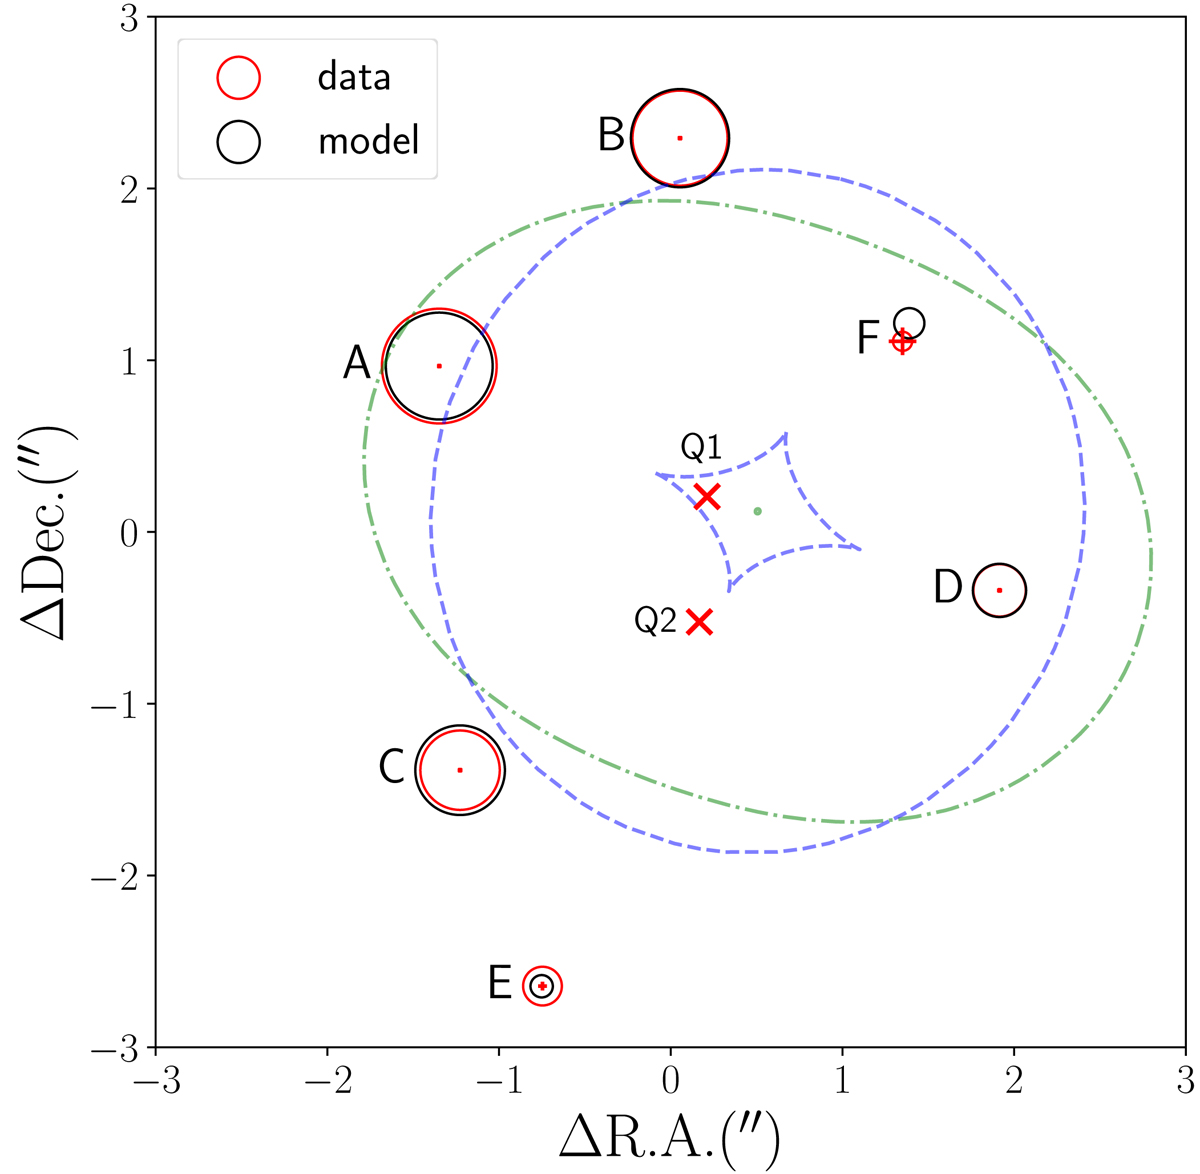
Summary of the SIE+shear mass model with two sources. The flux of the measured images (red), and predicted images (black), are proportional to the circle areas; these circles are centred on the relevant positions, along with red crosses showing the positions and astrometric uncertainties of the measurements. Critical curves and caustics are shown in green and blue, respectively. The two quasars are marked with red crosses, with Q1 corresponding to images ABCD, and Q2 to EF.
Current usage metrics show cumulative count of Article Views (full-text article views including HTML views, PDF and ePub downloads, according to the available data) and Abstracts Views on Vision4Press platform.
Data correspond to usage on the plateform after 2015. The current usage metrics is available 48-96 hours after online publication and is updated daily on week days.
Initial download of the metrics may take a while.