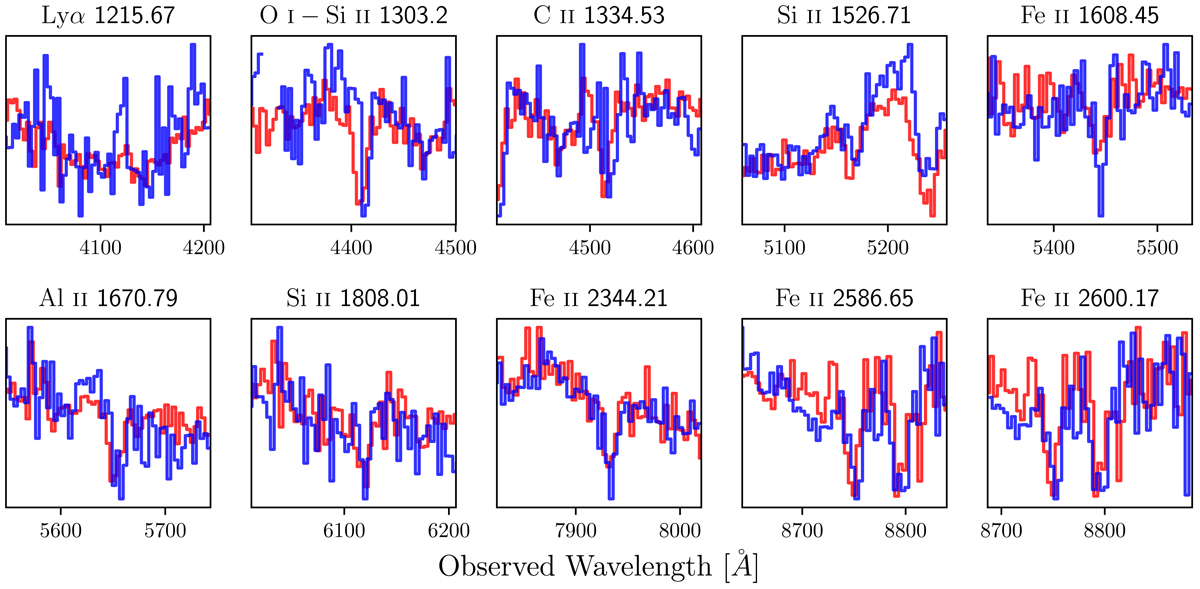
Fig. 4.
Download original image
Absorption profiles associated to the PDLA in the spectra of A (red) and C (blue). The spectra have been reddening-corrected based on the continuum, and normalised to have the same continuum flux. Redshift measurements associated to these lines are given in Table 2. We note that C IV absorption is also present as seen in the Si II-1526 panel. Any absorption lines falling near or within telluric absorption lines have been excluded, such as Fe II-2382, which is likely to be present. As in Fig. 2, the spectra are taken from separate epochs, and any absolute wavelength calibration should be assumed to be affected by possible systematic errors at the level of ∼1 pixel, i.e., ∼3 Å.
Current usage metrics show cumulative count of Article Views (full-text article views including HTML views, PDF and ePub downloads, according to the available data) and Abstracts Views on Vision4Press platform.
Data correspond to usage on the plateform after 2015. The current usage metrics is available 48-96 hours after online publication and is updated daily on week days.
Initial download of the metrics may take a while.