Fig. 2.
Download original image
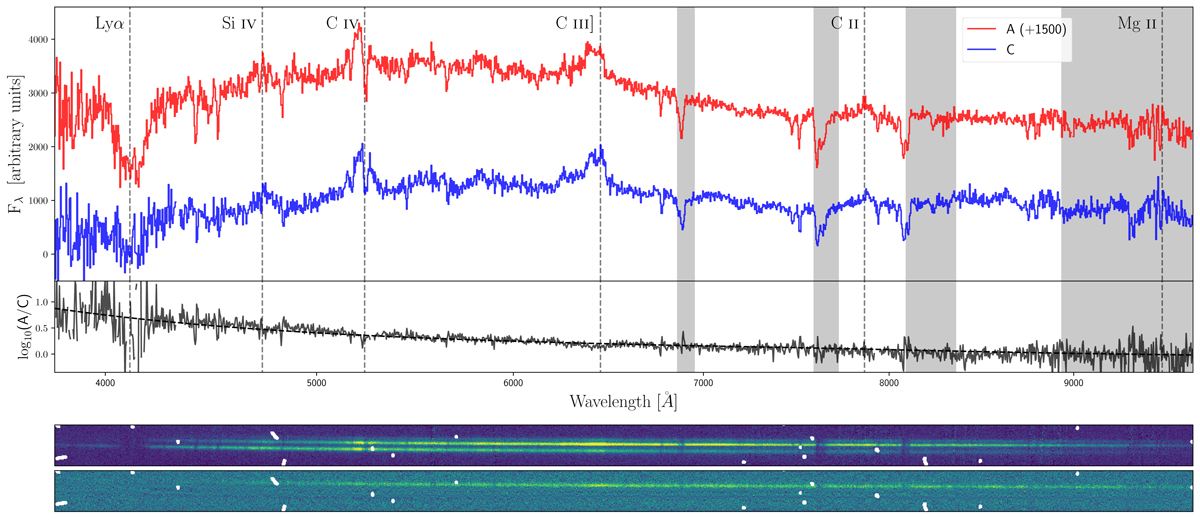
Top: spectra of A and C, and their flux ratio, with emission lines at z = 2.383 marked. Regions with strong telluric absorption are shaded. The best-fit reddening from an SMC-like galaxy at the source redshift is overlaid on the flux ratio. Middle: bias- and sky-subtracted 2D spectrum from the night of 17 April 2021. Bottom: same 2D spectrum after removing the traces of A and C, revealing the trace of point source E. The C III] emission line is clearly visible, and the 1D spectrum can be found in Fig. 3. The spectrum of A shown in the top panel is from 16 April 2021, because the slit was unknowingly offset to the west, thus capturing more flux from A.
Current usage metrics show cumulative count of Article Views (full-text article views including HTML views, PDF and ePub downloads, according to the available data) and Abstracts Views on Vision4Press platform.
Data correspond to usage on the plateform after 2015. The current usage metrics is available 48-96 hours after online publication and is updated daily on week days.
Initial download of the metrics may take a while.