Fig. 1.
Download original image
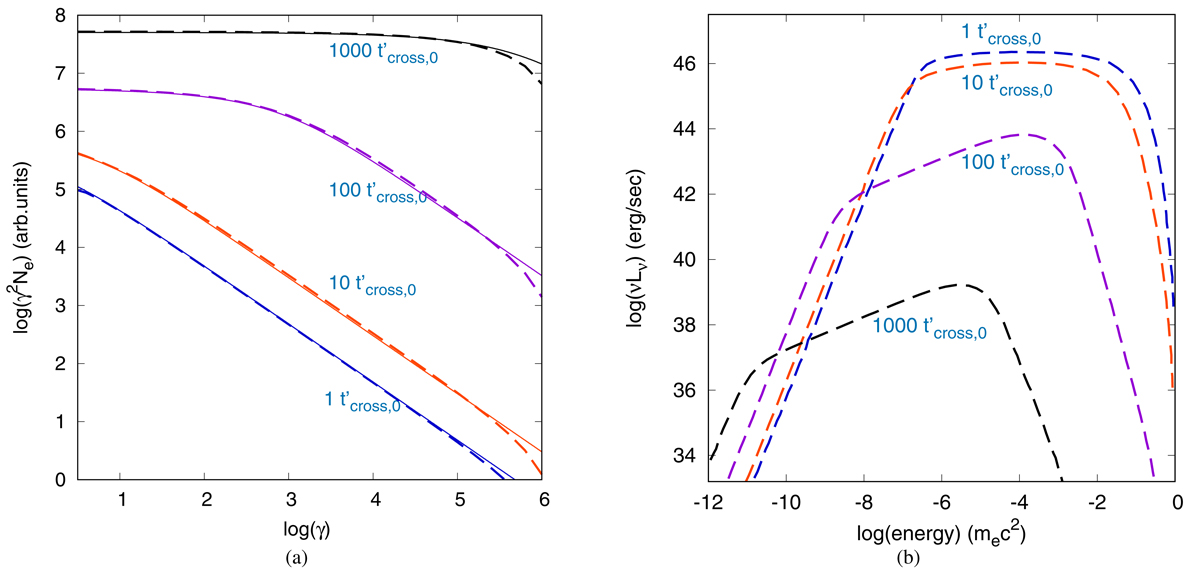
Electron and photon distribution. (a) Plot of the electron energy distribution at different time-steps for synchrotron and adiabatic losses only. The values of the parameters are ![]() cm,
cm, ![]() erg s−1, uexp = 0.1 c,
erg s−1, uexp = 0.1 c, ![]() G, γmin = 1, γmax = 106, p = 2, and δ = 10, while the profile of magnetic field strength decreases along B′∝R′ − 2 and the electron luminosity is constant in time. Full lines represent analytical solutions, while dashed lines the corresponding numerical ones. (b) Numerical results of the photon SED for the time instances of the depicted electrons.
G, γmin = 1, γmax = 106, p = 2, and δ = 10, while the profile of magnetic field strength decreases along B′∝R′ − 2 and the electron luminosity is constant in time. Full lines represent analytical solutions, while dashed lines the corresponding numerical ones. (b) Numerical results of the photon SED for the time instances of the depicted electrons.
Current usage metrics show cumulative count of Article Views (full-text article views including HTML views, PDF and ePub downloads, according to the available data) and Abstracts Views on Vision4Press platform.
Data correspond to usage on the plateform after 2015. The current usage metrics is available 48-96 hours after online publication and is updated daily on week days.
Initial download of the metrics may take a while.