Fig. 1.
Download original image
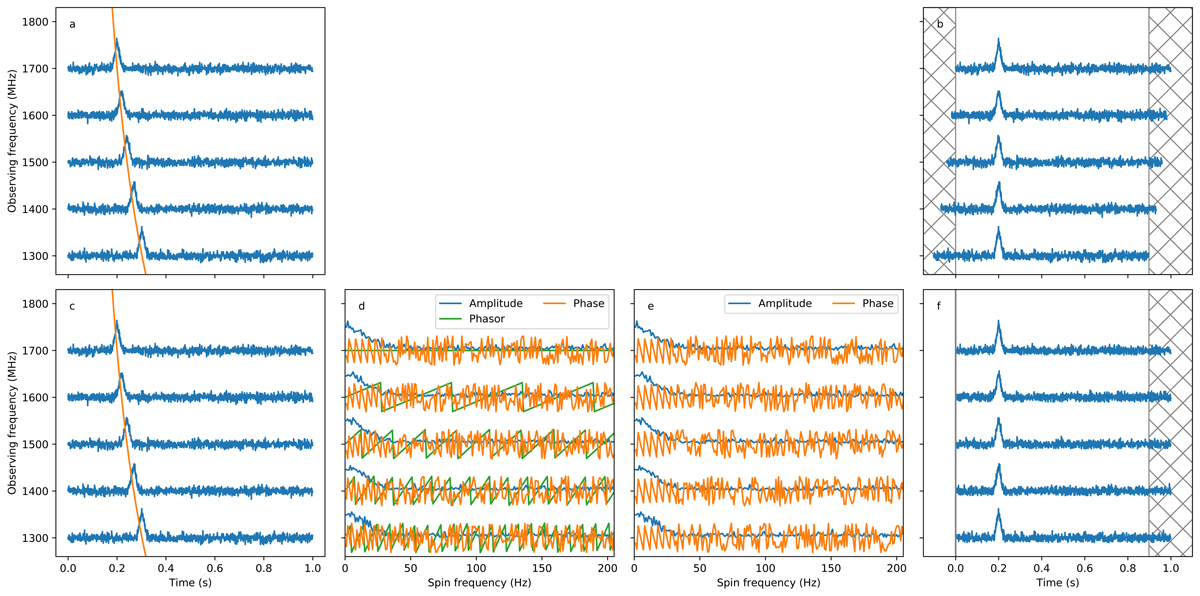
Comparison between time-domain dedispersion (top row) and FDD (bottom row), with (a) and (c) representing the input dynamic spectrum, (b) showing the dynamic spectrum after applying the appropriate delays for each frequency, (d) showing the Fourier transform of the time series (amplitude and phase) along with the phasors applied in 𝒯ν → DM, (e) showing the result after applying the phasors, and (f) showing the dynamic spectrum after the inverse Fourier transform, ![]() . The hashed regions in (b) and (f) represent data that should be discarded.
. The hashed regions in (b) and (f) represent data that should be discarded.
Current usage metrics show cumulative count of Article Views (full-text article views including HTML views, PDF and ePub downloads, according to the available data) and Abstracts Views on Vision4Press platform.
Data correspond to usage on the plateform after 2015. The current usage metrics is available 48-96 hours after online publication and is updated daily on week days.
Initial download of the metrics may take a while.