| Issue |
A&A
Volume 657, January 2022
|
|
|---|---|---|
| Article Number | A42 | |
| Number of page(s) | 9 | |
| Section | Planets and planetary systems | |
| DOI | https://doi.org/10.1051/0004-6361/202142092 | |
| Published online | 04 January 2022 | |
Formation age of the Rima Sharp sinuous rill on the Moon, source of the returned Chang’e-5 samples
1
State Key Laboratory of Lunar and Planetary Sciences, Macau University of Science and Technology,
Macao,
PR China
2
CNSA, Macau Center for Space Exploration and Science,
Macao,
PR China
3
Shandong Key Laboratory of Optical Astronomy and Solar-Terrestrial Environment, School of Space Science and Physics, Institute of Space Sciences, Shandong University,
Weihai,
Shandong,
264209,
PR China
e-mail: This email address is being protected from spambots. You need JavaScript enabled to view it.
Received:
26
August
2021
Accepted:
3
November
2021
Abstract
Context. In December 2020, China’s Chang’e-5 spacecraft successfully returned 1731 g of lunar samples to Earth. Rima Sharp, one of the longest sinuous rilles on the Moon, lies very near (<20 km) to the Chang’e-5 sampling site and is very likely to be the source of the returned samples. Constraining its formation age would provide key references for the ongoing sample analyses.
Aims. Our intent is to obtain the accurate formation ages of Rima Sharp and related lunar rilles through crater population studies and to assess their implications for the Chang’e-5 sample analyses and interpretations.
Methods. We utilized two separate techniques to measure and analyze craters that were formed after the formation of the studied sinuous rilles: the conventional crater statistics for the rille floors and the buffered crater statistics that are specialized in the dating of narrow linear features. We were able to carefully compare the results derived from the two methods and estimate the formation ages of these rilles.
Results. We suggest that the buffered crater statistic method produces more reliable ages for the studies rilles than the conventional method. The formation sequence of sinuous rilles around the Chang’e-5 site is proposed as follows, in chronological order: Rimae Harpalus, Louville, Sharp, and Mairan. The basalt samples returned by Chang’e-5 are likely to have mainly been sourced from Rima Sharp, with an estimated age of ~1.7 Ga based on the crater N(1) value (spatial density of craters ±1 km in diameter) of (2.10 ± 0.20) × 10−3 km−2 and the new crater chronology function (CF). The other, younger rille, Rima Mairan, which was formed ~1.0 Ga (N(1) = (1.17 ± 0.20) × 10−3 km−2 and with the same CF), may also contribute to the basaltic deposits at the landing site. These crater count statistics and dating results can be coordinated with the radio-isotopic age of Chang’e-5 samples for a recalibration of lunar impact flux and the crater population dating method.
Key words: Moon / planets and satellites: surfaces / planets and satellites: physical evolution
© ESO 2022
1 Introduction and background
On the 1st of December (UTC) 2020, China’s Chang’e-5 lunar sample return spacecraft successfully landed on the northeastern Oceanus Procellarum (43.06°N, 51.92°W; Wang et al. 2021) and returned 1731 g of samples to Earth on 16 December 2020. The landing site was later officially named Statio Tianchuan by the International Astronomical Union (IAU) (Fig. 1). The landing site is located in a mare unit (termed Em4/P58; ~37 000 km2 in area) with an estimated age ranging from ~1–2 Ga, based on previous crater count dating studies (Hiesinger et al. 2003; Morota et al. 2011; Qian et al. 2018, 2021a,c; Wu et al. 2018; Jia et al. 2020; Qiao et al. 2021b). This makes it among the youngest mare basalt units on the Moon (Hiesinger et al. 2003; Morota et al. 2011) and much younger than any returned lunar basalt samples or lunar meteorites (Qiao et al. 2021a). Geological knowledge concerning the provenance of these samples is essential for ongoing sample analyses and interpretations.
At ~17 km east of the Chang’e-5 landing and sampling site, a segment of sinuous rille is the most prominent volcanic feature in the nearby vicinity of the site (Fig. 1). Lunar sinuous rilles are generally interpreted to represent very high effusion rate (>104−105 m3 s−1) and long-duration volcanic eruptions on the Moon (e.g., Head & Wilson 2017). In the mapping by Hurwitz et al. (2013), this rille segment is interpreted to belong to one single sinuous rille that is named Rima Sharp, with a remarkable length of 566 km, making it the longest one among over 200 sinuous rilles on the Moon. However, an updated study (Qian et al. 2021b) proposed that the 566-km-long sinuous rille is composed of two separated rilles: the ~320 km-long (also termed Rima Sharp) in the north and the ~150 km-long Rima Mairan in the south. In addition, two small rilles, the ~76 km-long Rima Harpalus and the ~80 km-long Rima Louville are spatially connected to Rima Sharp. Rimae Sharp and Harpalus are interpreted to originate from the North Vent, Rima Mairan from the South Vent, and Rima Louville from the Northwest Vent (Fig. 1a). Among them, the rille-formation lava of Rima Sharp is likely to be the main source of the collected samples of Chang’e-5 (Qian et al. 2021b). Therefore, determining the ages of the sinuous rilles surrounding the Chang’e-5 sampling site is crucial to our understanding of the volcanic history around the sampling region.
Qian et al. (2021b) conducted conventional cumulative size-frequency distribution (CSFD) measurements on the floor of these rilles based on Kaguya TC mosaic with morning illumination and obtained absolute model ages (AMAs) of 2.20 Ga, 1.88 Ga, and 1.39 Ga for Rimae Louville, Sharp, and Mairan, respectively. However, previous studies have long noted that the conventional CSFD measurements have many inherent limitations for dating linear or curvilinear elongated features, especially with regard to the following two aspects: (1) the crater count working areas of the interiors of linear or curvilinear features are usually very small and, thus, very few craters can be found (the small-sample problem); (2) impact craters superposed on the narrow floors of linear or curvilinear features are relatively smaller and, thus, more susceptible to various resurfacing and modification processes, resulting in crater erosions and underestimations of the formation ages (e.g., Basilevsky et al. 2009; Chapman et al. 2010a,b; Bouley et al. 2010; Kneissl et al. 2015). In addition, crater counting within narrow linear or curvilinear features are particularly affected by steep topography and improper illumination conditions, introducing additional measurement uncertainties and disturbing the crater count dating results. Fortunately, the Buffered Crater Counting (BCC) technique has been demonstrated to being able to overcome these limitations of the conventional CSFD method and have successfully been used in crater count dating of many planetary linear features, including valleys, faults, and ridges (e.g., Fassett & Head 2008; Kneissl et al. 2015).
Moreover, sinuous rilles are generally very long, suggesting that the lava basalts surrounding the rilles are probably (in a spatial sense) very extensive and inevitably susceptible to the randomness distributions of impact craters. For example, the estimated ages of the lava basalts around Rima Sharp have a large variation from 1.4–2.5 Ga plus uncertainty (Qian et al. 2021a). In this case, although there are many crater counts and age estimations of the Em4/P58 unit, it is still practically difficult to identify the age of the rille from its adjacent lava basalts. In addition, the Chang’e-5 landing site itself is surrounded by multiple sinuous rilles and the question of which rilles are the exact source(s) of the Chang’e-5 basalt samples remains an open question. In the recent analysis by Qian et al. (2021b), both Rimae Sharp and Marian may source the Chang’e-5 landing site, further complicating the picture. Therefore, the accurate formation ages of these sinuous rilles estimated from the BCC technique and the comparison with ages of mare deposits surrounding the Chang’e-5 landing site can be very helpful in tracking the main source of the returned Chang’e-5 samples. Such a source determination would also provide a key context for interpreting lunar sinuous rille formation processes from the Chang’e-5 sample analysis results.
In this study, we revisit the ages of Rima Sharp and other sinuous rilles surrounding the Chang’e-5 landing site using both conventional CSFDs and BCC techniques and we discuss their implications for the analyses of the Chang’e-5 samples. The ages discrepancies determined from different lunar crater chronology functions are also assessed.
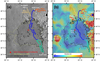 |
Fig. 1 Sinuous rilles in the vicinity of the Chang’e-5 landing site, Statio Tianchuan (Kaguya Terrain Camera (TC) Morning Map, 10 m pixel−1; Haruyama et al. 2008) (a). SELENE/Kaguya TC + Lunar Reconnaissance Orbiter (LRO) Lunar Orbiter Laser Altimeter (LOLA) merged topography (SLDEM2015; 512 pixel degree−1; Barker et al. 2016) overlaid on the same TC images (b). Small branches of the rilles are not shown. The Chang’e-5 site is indicated bythe red triangle and the boundaries of P58 (Hiesinger et al. 2003) and Em4 (Qian et al. 2021a) mare units are delineated by dashed yellow and solid black curves, respectively. The South Vent, North Vent, and Northwest Vent are labeled. All the maps in this work are projected in Mercator projection centered at the Chang’e-5 landing site. |
2 Data and method
2.1 The conventional crater counting technique
The boundaries of Rima Sharp and the other three sinuous rilles (Fig. 1) are delineated mainly from the Kaguya Terrain Camera (TC) images (10 m pixel−1; Haruyama et al. 2008). Images under various illumination conditions (i.e., morning, evening, and ortho illuminations) are used for boundary delineation and crater identification to minimize the influence of shadowed regions. Lunar Reconnaissance Orbiter Narrow Angle Camera (LROC NAC, images ~1 m pixel−1) are also referred to when more detailed investigations are needed. Given the 10 m pixel size of the Kaguya TC images, only impact craters larger than 100 m in diameter (10 pixel size) are identified and measured for age determination in this study. Very small branches (with widths narrower than about the half width of their main rilles) of the rilles are excluded from crater count investigations.
As lunar sinuous rilles are generally interpreted as having been formed by high-volume volcanic eruptions (e.g., Head & Wilson 2017), massive effusive lava flows during the rille-forming volcanic eruptions should have erased all pre-existing craters in the locations of the current rille floors. So, all the craters with their center on the rille floors can be considered as post-dating the rilles and used for conventional crater count dating analyses (it is possible that some relatively large craters might survive the rille-formation eruptions, while our morphological survey does not find such pre-existing craters). The distribution of cumulative crater density (frequency, ρ) with respect to crater size (i.e., the conventional CSFDs) can be derived according to the standard procedure of Crater Analysis Techniques Working Group (1979), and the uncertainties are defined by ± ρ∕N1?2, where N is the corresponding number of cumulative craters. In order to improve statistic reliability, we carefully exclude secondary craters (based on their morphological characteristics; Oberbeck & Morrison 1974; Shoemaker 1962), steep wall slumping regions, and ambiguous connected regions between rilles (Fig. 2). In this study, we measure the counting area and superposed impact craters (locations and diameters) using the CraterTools extension in the ArcGIS platform, which is independent of the employed map projection manner (Kneissl et al. 2011).
2.2 The buffered crater counting (BCC) approach
The principle of the BCC technique is that all post-formation craters with centers inside the buffer region around the linear and curvilinear features (Fig. 3a) – thus, not only those within the outlines of the studied features (i.e., the conventionalCSFDs method) – can be used for determining the formation ages of the linear and curvilinear features. The effective working area (i.e., the buffer area enclosing the studied geological feature) of each counted crater is a function of the crater size, signifying that a larger counted crater has a larger effective area than a smaller one (Tanaka 1982; Wichman & Schultz 1989; Fassett & Head 2008). Compared to the conventional CSFDs method, the BCC approach increases both the number andsizes of craters used in the crater-counting analysis; thus, it is less influenced by various resurfacing processes and can improve the statistic reliability of crater count dating analysis (Wichman & Schultz 1989; Kneissl et al. 2015).
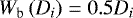
The buffer width Wb circumscribing the linear or curvilinear feature is determined from the size of each counted crater and the spatial superposition relationship between the crater rim or ejecta blanket and the studied linear or curvilinear feature. However, different values of the buffer width have been proposed by various researchers. In the studies of Tanaka (1982) and Wichman & Schultz (1989), one crater radius (0.5Di) is adopted (known as the “simple approach”). In this approach, only craters with their rims cutting the studied linear or curvilinear features are counted. In some later studies, three crater radii (1.5Di) or two radii (1Di) are used as the buffer width (the “ejecta approach”; e.g., Namiki & Solomon 1994; Fassett & Head 2008; Kneissl et al. 2015). In this method, craters with their ejecta blankets cutting the studied linear or curvilinear features are counted, and the continuous deposits is assumed to “extend about one or two crater radii beyond the crater rim” (Melosh 1989). Some studies (e.g., Fassett & Head 2008; Kneissl et al. 2015) have shown that similar ages can be derived using the BCC approach with buffer width ranging between one and three crater radii, and the determination of buffer width depends on the sizes of the counted craters, crater ejecta degradation states, and the homogeneousness of local geologic unit which may vary on a case-by-case basis (Kneissl et al. 2015).
For each counted crater with a diameter of Di and a buffer width of Wb(Di), the buffer area A(Di) is:
![Mathematical equation: \begin{equation*} A\left(D_i\right) = LW+2LW_{\textrm{b}}\left(D_i\right)+2WW_{\textrm{b}}\left(D_i\right)+\pi [W_{\textrm{b}}\left(D_i\right)]^{2} \,, \end{equation*}](/articles/aa/full_html/2022/01/aa42092-21/aa42092-21-eq1.png) (1)
(1)
where L and W are the length and width of the studied linear feature, respectively (Fig. 3a).
If the center of a post-formation crater is located within its defined buffer area, we incorporated the crater for subsequent crater population analysis (counted; as in Fig. 3), and the effective density for this crater is 1∕A(Di). The cumulative density Nc (D > Dc) is the sum of each effective density for all craters with Di > Dc (Tanaka 1982; Hirata 2016):
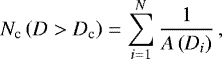 (2)
(2)
where N is the total number of craters with diameter larger than completeness diameter Dc identified using the BCC technique. The corresponding 1σ confidence uncertainty is defined as ± NcN1?2 (Tanaka 1982).
Ideally, the buffer areas are required to be much larger than the areas of the studied linear features themselves (Kneissl et al. 2015), so the choice of larger buffer width (i.e., the “ejecta approach”) could increase the crater number and improve the statistic reliability of crater counting. However, comparison experimentsshowed that the larger buffer widths of 2R and 3R may be appropriate for larger craters (D > 1.4 km and D = 2–32 km,respectively; Kneissl et al. 2015). Given that most craters that are crossing and in the vicinity of our studied rilles are smaller than 1.4 km in diameter, we chose the buffer width of 1R (the “simple approach”) in this study. The buffer area and buffered crater measurements are generated by the Buffered Crater Counting module of the CraterTools (Fig. 3b; Kneissl et al. 2015).
2.3 Age determination from crater statistics
On a homogeneous geologic unit, impact craters ceaselessly accumulate over time, leading to older surfaces having higher crater densities than the younger ones for a given crater size until crater equilibrium (or saturation) is reached; this is the principle for relative crater count dating. The CSFDs that formed directly from the impact flux without crater obliteration can be described by the crater production function (PF). In this study, we adopted the commonly used crater production function of Neukum et al. (2001), which describes the cumulative crater density N (D) (in km−2) for craters larger than D (in km) as a function of D by an 11-order polynomial:
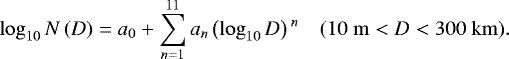 (3)
(3)
By assigning the same value of a1 to a11 (describing the shape of CSFD curves) in Neukum et al. (2001) and fitting our observed CSFDs to Eq. (3), the parameter a0 (describing the crater frequency for a given diameter) can be determined. The cumulative crater density for D > 1 km (i.e., N(1) in km−2) can be directly obtained from N(1) = 10a0. The CSFD fitting procedures in this study are conducted by the CraterStats software (Michael & Neukum 2010; Michael 2013).
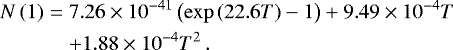
The relationship between cumulative crater density (N(1) value) and surface age T (in Gyr), termed the crater chronology function (CF), was established by linking the crater counts with the absolute ages of returned lunar samples. We use two chronology functions to compute the AMAs of each sinuous rille: the first is the commonly used chronology function of Neukum et al. (2001, Neukum CF hereafter) established using crater counts on Apollo photographs:
 (4)
(4)
The second is the newly established chronology function of Robbins (2014, which we denote hereafter as Robbins CF,) using crater counting data from new LROC image data:
 (5)
(5)
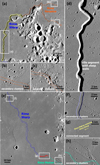 |
Fig. 2 Regions excluded from the mapped extents of sinuous rilles (Fig. 1) for crater counts in this study (yellow striped-filled, red striped-filled, and black outlined regions) and their detailed views. (a− d) The northernmost ~70 km segment of Rima Sharp with U-shaped cross-section profiles and very steep inner walls (yellow striped-filled region) and the secondary crater clusters (black outlined regions) crossing Rima Harpalus. (e− h) The secondary crater clusters (black outlined regions) crossing Rimae Sharp and Mairan and the connected segment of the two rilles (red striped-filled region). The basemaps are all TC morning mosaic. |
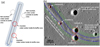 |
Fig. 3 Schematic illustration showing the buffer area (the gray region) circumscribing the studied linear feature (outlined in black) with a width of Wb = 1 R for a crater with a radius of R, and the counted post-formation craters (the red circles) by the BCC approach (a). Examples of the identified BCC craters (the red circles) in a segment of Rima Mairan (blue curves) and their corresponding buffer areas ( |
3 Results
3.1 Conventional CSFD dating results
In our conventional crater population dating analyses, a total of 761, 189, 60, and 55 impact craters ≥100 m in diameter are identified in the working regions (Figs. 1 and 2) on the floors of Rimae Sharp, Mairan, Harpalus, and Louville, respectively. The derived cratering population are then displayed in cumulative plots to recognize possible deviations from isochrons (Fig. 4), especially in the smaller diameter ranges that are typically indicators of crater equilibrium (or saturation), secondary contamination, and resurfacing events. We carefully choose the diameter range for age fitting for each studied rille based on its observed cumulative CSFD curve. The conventional CSFD-fitted N(1) for Rimae Sharp, and Mairan, Harpalus, and Louville is (2.14 ± 0.23) × 10−3 km−2, (1.02 ± 0.36) × 10−3 km−2, (5.90 ± 2.07) × 10−3 km−2, and (4.19 ± 1.86) × 10−3 km−2, respectively. Under the Neukum CF, these N(1) values would project AMAs of 2.6 ± 0.3 Ga, 1.2 ± 0.4 Ga,  Ga, and
  Ga, respectively (Fig. 4a), while the updated Robbins CF would report somewhat younger or comparable ages of 1.7 ± 0.1 Ga (Sharp), 0.9 ± 0.3 Ga (Mairan),
  Ga (Harpalus), and
  Ga (Louville). Compared with the dating results (Table 1) of Rimae Sharp (1.88 ± 0.3 Ga), Mairan (1.39 ± 0.24 Ga) and Louville (2.20 ± 0.5 Ga) by Qian et al. (2021b) using similar conventional CSFDs method and the Neukum CF (these authors did not date Rima Harpalus due to its steep topography and improper image illumination), our ages under the Neukum CF for Rimae Sharp and Louville are substantially older, even considering the uncertainties; our age of Rima Mairan is comparable within the uncertainty range; and the relatively chronological order among the three rilles remains consistent with Qian et al. (2021b). We address that our considerably larger ages (i.e., larger N(1) observations) can be attributed to variations in the employed image data. We used images with multiple illuminations (i.e., morning, evening, and ortho illuminations), which could reduce the effects of shadowed regions and improve the number of identifiable craters and the statistic reliability of crater counts within narrow linear features.
3.2 BCC dating results
In our BCC dating analyses, a total of 858, 236, 82, and 80 impact craters (D ≥ 100 m) are identified in the buffer regions circumscribing Rimae Sharp, Mairan, Harpalus, and Louville, respectively. Using the optimal ranges for PF fitting, the N(1) values for these four rilles are calculated as (2.10 ± 0.20) × 10−3 km−2, (1.17 ± 0.30) × 10−3 km−2, (3.25 ± 1.02) × 10−3 km−2, and (2.76 ± 0.86) × 10−3 km−2, respectively. Compared with the N(1) values obtained by Qiao et al. (2021b) through conventional CSFDs (1.57 × 10⁻³ km−2 for Rima Sharp, 1.84 × 10⁻³ km−2 for Rima Louville, and 1.16 × 10⁻³ km−2 for Rima Marian; Table 1), our BCC N(1) observations for Rimae Sharp and Louville are over 30–50% larger, and our BCC N(1) for Rima Marian are close to that of Qian et al. (2021b). The N(1) values from our BCC analysis retain the same relative orders to those derived from the conventional CSFD method (Sect. 3.1), while the former show smaller uncertainties for all studied rilles, demonstrating the robustness of both crater statistical methods and the higher reliability of BCC approach for dating elongated features. These BCC N(1) values correspond to AMAs of 2.5 ±0.2 Ga (Sharp), 1.4 ± 0.4 Ga (Mairan),  Ga (Harpalus), and
  Ga (Louville) based on the Neukum CF, respectively (Fig. 4b). The Robbins CF also produce relatively younger AMAs of 1.7 ± 0.1 Ga, 1.0 ± 0.2 Ga,
  Ga, and 2.1 ± 0.5 Ga, respectively.
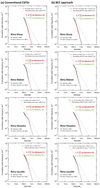 |
Fig. 4 CSFD measurements and dating results for Rimae Sharp, Mairan, Harpalus, and Louville obtained by: (a) the conventional counts and (b) BCC approach. The production function (PF) of Neukum et al. (2001) is used for crater fitting, and the equilibrium function (EF) of Hartmann (1984) is shown for indicating the crater saturation situations. The absolute model ages (AMAs) derived from chronology functions (CF) of Neukum et al. (2001) and Robbins (2014) are labelled.In the plots of the BCC approach, the area values are those of the studied rille features, not those of the buffered regions (Table 1). |
3.3 Summary of crater population dating results
(1) In either crater counting method (conventional CSFDs or BCC) and cratering chronology functions (Neukum or Robbins), the relative chronological sequence among the four studied sinuous rilles remains the same as the following, inchronological order: Rimae Harpalus, Louville, Sharp, and Mairan. This sequence is fully consistent with that ofQian et al. (2021b). (2) For all crater counting results, the Robbins CF prefer to produce younger or similar ages than the Neukum CF. For the two largest sinuous rilles, Rimae Sharp and Mairan, the Robbins CF also produce smaller age uncertainties. These discrepancies indicate that the crater population-based age estimations of specific regions are highly dependent on the accuracy of chronology functions, which is expected to be improved by the laboratorial dating of Chang’e-5 returned samples. The other two rilles, Rimae Harpalus and Louville are much shorter, and consequently, the crater cratering and ages are of considerable uncertainties based on both CFs. As the Robbins CF is established from crater count data from uniform and new LROC images (Robbins 2014), compared with the Neukum CF that is based on crater counts on Apollo image data of over half a century old, we prefer to apply the ages calculated from the Robbins CF. (3) Most of the BCC-derived AMAs, except for Rima Mairan, are relatively younger than those from conventional crater counts. Moreover, the BCC approach tends to produce smaller uncertainties than the conventional method, especially for the two larger rilles.
4 Discussion
4.1 Chronology of the sinuous rilles around the Chang’e-5 landing site
We found that both conventional and BCC approaches obtain consistent relative ages for all the four studied rilles and the buffered crater counts produce smaller uncertainties of N(1) observations and thus prove to be of greater reliability. In addition, some flaws are observed in the conventional crater counting results. (1) Due to various crater erasure processes, the actual CSFDs on the floor of the linear feature are likely to be underestimated and the observed conventional CSFDs were regarded to represent the lower limits of the features’ formation ages (e.g., Neukum et al. 2010; Kneissl et al. 2015). Therefore, the conventional method is supposed to yield smaller N(1) values and model ages for the four studied rilles than the BCC approach. However, the actual observations reveal results that are to the contrary: the conventional approach produces generally larger N(1) values, for most of our studied rilles, than the BCC technique (Fig. 4). We attribute this discrepancy to the fact that a part of the identified floor craters used for N(1) fitting are considerably large and close to the widths of the rilles (e.g., eight floor craters of ~0.5–0.9 km in diameter are used for the N(1) fitting of Rima Sharp, comparable to the average width of 0.9 km of the rille, Fig. 4a). This would underestimate the effective crater count working area and thus overestimate the crater density of those large craters, resulting in a larger fitted N(1) values (Platz et al. 2013). By comparison, the BCC approach has deliberated the effect of relatively largest crater on the crater count working area and make appropriate determinations of the effective area. (2) The CSFD curve for the Rima Mairan floor is observed to show an upward deviation from isochrone in the smaller diameter range (200–300 m) (Fig. 4a). This is abnormal as typical CSFD curves are usually characterized with a downward turnover at smaller diameters due to preferred erasure and saturation of smaller craters. We attribute the CSFD anomaly to the contamination from secondary craters that are hardly identified and excluded manually, while the BCC counts can generally eliminate this anomaly (Fig. 4b). In summary, we suggest that the BCC approach produces more accurate crater counts and formation ages for rilles around the Chang’e-5 site than the conventional crater counts, which agrees with the findings of previous studies (e.g., Fassett & Head 2008; Kneissl et al. 2015).
Based on the BCC approach and the Robbins CF, we propose the following formation sequences for the four rilles surrounding the Chang’e-5 landing site: Rima Harpalus, which originated from the North Vent, was first formed ~2.3 Ga ago, followed by the Rima Louville originated from the NorthWest Vent ~2.1 Ga ago. It should be noted that due to the small length of these two rilles, very few (n < 10) craters are used for age determination. The dating results are, therefore, of considerable uncertainties (Table 1), and the age difference of the two rilles are within their error ranges. Besides, these two rilles are not spatially overlapped and the cross-cutting relationship shows both rilles pre-date Rima Sharp (thus, a stratigraphical order between the two rilles can not be determined). After about 0.4 Gyr of the Rima Louville formation, Rima Sharp, also originated from the North Vent, formed at ~1.7 Ga ago. The Rima Sharp-formation eruptions produce extensive lava flows around the Chang’e-5 site (i.e., the Em4/P58 unit). Finally, Rima Mairan, originated from the South Vent, formed at ~1.0 Ga, met Rima Sharp at ~40.4°N, 48.4°W. We note that, alternatively, the formation ages of the four corresponding rilles are ~3.3 Ga, 3.1 Ga, 2.5 Ga, and 1.4 Ga, respectively, if the Neukum CF is adopted.
4.2 Implications for the Chang’e-5 sample age
Being very close (<20 km) to the Chang’e-5 landing site, voluminous lava flows produced during the Rima Sharp-formation eruption would source the mare plains surrounding the landing site. Therefore, the basalt samples returned by Chang’e-5 are likely to mainly come from Rima Sharp. Based on the BCC measurements in this work, the age of Rima Sharp has been determined as ~1.7 Ga using the BCC approach and the Robbins CF model. In addition, it has also been suggested that the much younger Rima Mairan, dated to be ~1.0 Ga in this work, has also contributed basaltic deposits at the landing site (Qian et al. 2021b). We note that, alternatively, the ages of these two rilles are ~2.5 Ga and 1.4 Ga, respectively, if the Neukum CF is adopted. The N(1) value (a function of the age) of Rima Sharp measured in this work is generally relatively larger (thus, with an older age) than those of the Em4/P58 mare unit across the Chang’e-5 landing site (Table 1). This is consistent with our proposal of Rima Sharp as the source of this mare unit. Our crater population analysis provides an independent assessment concerning the provenance and age of the returned Chang’e-5 samples. Moreover, some preliminary radio-isotopic ages around 2.0 Ga have been reported recently (Che et al. 2021; Li et al. 2021), which provide key “ground-truth” for anchoring the lunar crater chronology function. The obvious disparities between these radio-isotopic dating ages and our crater population dating results show that both the Neukum and Robbins CFs are of considerable uncertainties in the middle part of lunar history and a re-calibration effort of the lunar cratering chronology using new Chang’e-5 data is urgently needed (e.g., Qiao et al. 2021b). Besides, as has shown in the Apollo/Luna sample analyses, a considerable range of radio-isotopic ages are often obtained from samples collected at a certain site (e.g., Stöffler & Ryder 2001). We expect that the situation may be similar to the Chang’e-5 samples. Thus, more sample dating analyses and coordinated remote sensing studies are needed to correlate the returned sample to a specific geological unit on the lunar surface.
Summary and comparisons of crater dating results.
5 Conclusions
In this work, we conducted detailed crater statistics for the four sinuous rille around the Chang’e-5 landing site using both conventional CSFD and BCC approaches. We find that the BCC method obtains more accurate dating results for the four studied rilles than the conventional method. The ages of these rilles are determined as the following using the Robbins CF: 2.3 Ga for Rima Harpalus, 2.1 Ga for Rima Louville, 1.7 Ga for Rima Sharp, and 1.0 Ga for Rima Mairan. The ages using Neukum CF are 3.3 Ga for Rima Harpalus, 3.1 Ga for Rima Louville, 2.5 Ga for Rima Sharp, and 1.4 Ga for Rima Mairan, respectively.
The basalt samples returned by Chang’e-5 are likely to mainly come from the Rima Sharp formed around 1.7 Ga (Robbins CF)/2.5 Ga (Neukum CF) ago, and the younger 1.0-Ga-old (Robbins CF)/1.4-Ga-old (Neukum CF) Rima Mairan may also contribute to the mare deposits at the sampling site. Our dating results deepen the overall knowledge of the provenance of the Chang’e-5 samples and help establish a more accurate crater density-age relationship.
Acknowledgements
The authors wish to thank Drs. Minggang Xie, Yuqi Qian and Yazhou Yang for their valuable discussions on writing the manuscript. This work was supported by the Science and Technology Development Fund, Macau SAR, (File no. SKL-LPS(MUST)-2021-2023) and the pre-research project on Civil Aerospace Technologies No D020204 funded by China National Space Administration (CNSA). Kaguya/SELENE TC image data can be downloaded from SELENE Data Archive (https://darts.isas.jaxa.jp/planet/pdap/selene/), and SLDEM2015 topography data are available at the Planetary Geodynamics Data Archive (PGDA) (https://pgda.gsfc.nasa.gov/products/54).
References
- Barker, M., Mazarico, E., Neumann, G., et al. 2016, Icarus, 273, 346 [CrossRef] [Google Scholar]
- Basilevsky, A. T., Neukum, G., Werner, S. C., et al. 2009, Planet. Space Sci., 57, 917 [NASA ADS] [CrossRef] [Google Scholar]
- Bouley, S., Craddock, R. A., Mangold, N., & Ansan, V. 2010, Icarus, 207, 686 [CrossRef] [Google Scholar]
- Chapman, M. G., Neukum, G., Dumke, A., et al. 2010a, Earth Planet. Sci. Lett., 294, 256 [Google Scholar]
- Chapman, M. G., Neukum, G., Dumke, A., et al. 2010b, Earth Planet. Sci. Lett., 294, 238 [Google Scholar]
- Che, X., Nemchin, A., Liu, D., et al. 2021, Science, 374, 887 [NASA ADS] [CrossRef] [Google Scholar]
- Crater Analysis Techniques Working Group (Arvidson, R. E., et al.) 1979, Icarus, 37, 467 [NASA ADS] [CrossRef] [Google Scholar]
- Fassett, C. I., & Head, J. W. 2008, Icarus, 195, 61 [NASA ADS] [CrossRef] [Google Scholar]
- Hartmann, W. K. 1984, Icarus, 60, 56 [CrossRef] [Google Scholar]
- Haruyama, J., Matsunaga, T., Ohtake, M., et al. 2008, Earth, Planets Space, 60, 243 [NASA ADS] [CrossRef] [Google Scholar]
- Head, J. W., & Wilson, L. 2017, Icarus, 283, 176 [CrossRef] [Google Scholar]
- Hiesinger, H., Head III, J., Wolf, U., Jaumann, R., & Neukum, G. 2003, J. Geophys. Res. Planets, 108, E7 [CrossRef] [Google Scholar]
- Hirata, N. 2016, J. Geophys. Res. Planets, 121, 2325 [NASA ADS] [CrossRef] [Google Scholar]
- Hurwitz, D. M., Head, J. W., & Hiesinger, H. 2013, Planet. Space Sci., 79, 1 [CrossRef] [Google Scholar]
- Ivanov, B., Neukum, G., & Wagner, R. 2001, in Collisional Processes in the Solar System (Berlin: Springer), 1 [Google Scholar]
- Jia, M., Yue, Z., Di, K., et al. 2020, Earth Planet. Sci. Lett., 541, 116272 [CrossRef] [Google Scholar]
- Kneissl, T., van Gasselt, S., & Neukum, G. 2011, Planet. Space Sci., 59, 1243 [NASA ADS] [CrossRef] [Google Scholar]
- Kneissl, T., Michael, G., Platz, T., & Walter, S. 2015, Icarus, 250, 384 [CrossRef] [Google Scholar]
- Li, Q.-L., Zhou, Q., Liu, Y., et al. 2021, Nature, 600, 54 [CrossRef] [Google Scholar]
- Melosh, H. J. 1989, Impact cratering: A geologic process (New York: Oxford University Press, Oxford: Clarendon Press), 90 [Google Scholar]
- Michael, G. 2013, Icarus, 226, 885 [NASA ADS] [CrossRef] [Google Scholar]
- Michael, G., & Neukum, G. 2010, Earth Planet. Sci. Lett., 294, 223 [Google Scholar]
- Morota, T., Haruyama, J., Ohtake, M., et al. 2011, Earth Planet. Sci. Lett., 302, 255 [Google Scholar]
- Namiki, N., & Solomon, S. C. 1994, Science, 265, 929 [NASA ADS] [CrossRef] [Google Scholar]
- Neukum, G. 1983, PhD thesis, Ludwig-Maximilians-Univ., Munich, Germany [Google Scholar]
- Neukum, G., & Ivanov, B. 1994, Hazards due to Comets and Asteroids (Tucson: University of Arizona Press), 359 [Google Scholar]
- Neukum, G., Ivanov, B. A., & Hartmann, W. K. 2001, Chronology and evolution of Mars (Berlin: Springer), 55 [NASA ADS] [CrossRef] [Google Scholar]
- Neukum, G., Basilevsky, A., Kneissl, T., et al. 2010, Earth Planet. Sci. Lett., 294, 204 [Google Scholar]
- Oberbeck, V., & Morrison, R. 1974, The Moon, 9, 415 [NASA ADS] [CrossRef] [Google Scholar]
- Platz, T., Michael, G., Tanaka, K. L., Skinner Jr, J. A., & Fortezzo, C. M. 2013, Icarus, 225, 806 [CrossRef] [Google Scholar]
- Qian, Y., Xiao, L., Zhao, S., et al. 2018, J. Geophys. Res. Planets, 123, 1407 [CrossRef] [Google Scholar]
- Qian, Y., Xiao, L., Head, J. W., et al. 2021a, Earth Planet. Sci. Lett., 555, 116702 [Google Scholar]
- Qian, Y., Xiao, L., Head, J. W., & Wilson, L. 2021b, Geophys. Res. Lett., 48, e2021GL092663 [Google Scholar]
- Qian, Y., Xiao, L., Wang, Q., et al. 2021c, Earth Planet. Sci. Lett., 561, 116855 [CrossRef] [Google Scholar]
- Qiao, L., Chen, J., Xu, L., et al. 2021a, Icarus, 364, 114480 [CrossRef] [Google Scholar]
- Qiao, L., Xu, L., Yang, Y., et al. 2021b, Geophys. Res. Lett., 48, e2021GL095132 [Google Scholar]
- Robbins, S. J. 2014, Earth Planet. Sci. Lett., 403, 188 [Google Scholar]
- Shoemaker, E. M. 1962, Physics and Astronomy of the Moon (Cambridge: Academic Press Books), 283 [Google Scholar]
- Stöffler, D., & Ryder, G. 2001, Chronology and Evolution of Mars (Berlin: Springer), 9 [CrossRef] [Google Scholar]
- Tanaka, K. 1982, NASA Technical Memo, NASA TM-85127, 123 [Google Scholar]
- Wagner, R., Head Iii, J., Wolf, U., & Neukum, G. 2002, J. Geophys. Res. Planets, 107, 14 [Google Scholar]
- Wang, J., Zhang, Y., Di, K., et al. 2021, Remote Sens., 13, 590 [NASA ADS] [CrossRef] [Google Scholar]
- Wichman, R., & Schultz, P. 1989, J. Geophys. Res. Solid Earth, 94, 17333 [NASA ADS] [CrossRef] [Google Scholar]
- Wu, B., Huang, J., Li, Y., Wang, Y., & Peng, J. 2018, J. Geophys. Res. Planets, 123, 3256 [NASA ADS] [CrossRef] [Google Scholar]
- Xu, Z., Guo, D., & Liu, J. 2021, Remote Sens., 13, 1515 [NASA ADS] [CrossRef] [Google Scholar]
All Tables
All Figures
|
Fig. 1 Sinuous rilles in the vicinity of the Chang’e-5 landing site, Statio Tianchuan (Kaguya Terrain Camera (TC) Morning Map, 10 m pixel−1; Haruyama et al. 2008) (a). SELENE/Kaguya TC + Lunar Reconnaissance Orbiter (LRO) Lunar Orbiter Laser Altimeter (LOLA) merged topography (SLDEM2015; 512 pixel degree−1; Barker et al. 2016) overlaid on the same TC images (b). Small branches of the rilles are not shown. The Chang’e-5 site is indicated bythe red triangle and the boundaries of P58 (Hiesinger et al. 2003) and Em4 (Qian et al. 2021a) mare units are delineated by dashed yellow and solid black curves, respectively. The South Vent, North Vent, and Northwest Vent are labeled. All the maps in this work are projected in Mercator projection centered at the Chang’e-5 landing site. |
| In the text | |
|
Fig. 2 Regions excluded from the mapped extents of sinuous rilles (Fig. 1) for crater counts in this study (yellow striped-filled, red striped-filled, and black outlined regions) and their detailed views. (a− d) The northernmost ~70 km segment of Rima Sharp with U-shaped cross-section profiles and very steep inner walls (yellow striped-filled region) and the secondary crater clusters (black outlined regions) crossing Rima Harpalus. (e− h) The secondary crater clusters (black outlined regions) crossing Rimae Sharp and Mairan and the connected segment of the two rilles (red striped-filled region). The basemaps are all TC morning mosaic. |
| In the text | |
|
Fig. 3 Schematic illustration showing the buffer area (the gray region) circumscribing the studied linear feature (outlined in black) with a width of Wb = 1 R for a crater with a radius of R, and the counted post-formation craters (the red circles) by the BCC approach (a). Examples of the identified BCC craters (the red circles) in a segment of Rima Mairan (blue curves) and their corresponding buffer areas ( |
| In the text | |
|
Fig. 4 CSFD measurements and dating results for Rimae Sharp, Mairan, Harpalus, and Louville obtained by: (a) the conventional counts and (b) BCC approach. The production function (PF) of Neukum et al. (2001) is used for crater fitting, and the equilibrium function (EF) of Hartmann (1984) is shown for indicating the crater saturation situations. The absolute model ages (AMAs) derived from chronology functions (CF) of Neukum et al. (2001) and Robbins (2014) are labelled.In the plots of the BCC approach, the area values are those of the studied rille features, not those of the buffered regions (Table 1). |
| In the text | |
Current usage metrics show cumulative count of Article Views (full-text article views including HTML views, PDF and ePub downloads, according to the available data) and Abstracts Views on Vision4Press platform.
Data correspond to usage on the plateform after 2015. The current usage metrics is available 48-96 hours after online publication and is updated daily on week days.
Initial download of the metrics may take a while.