Fig. 7
Download original image
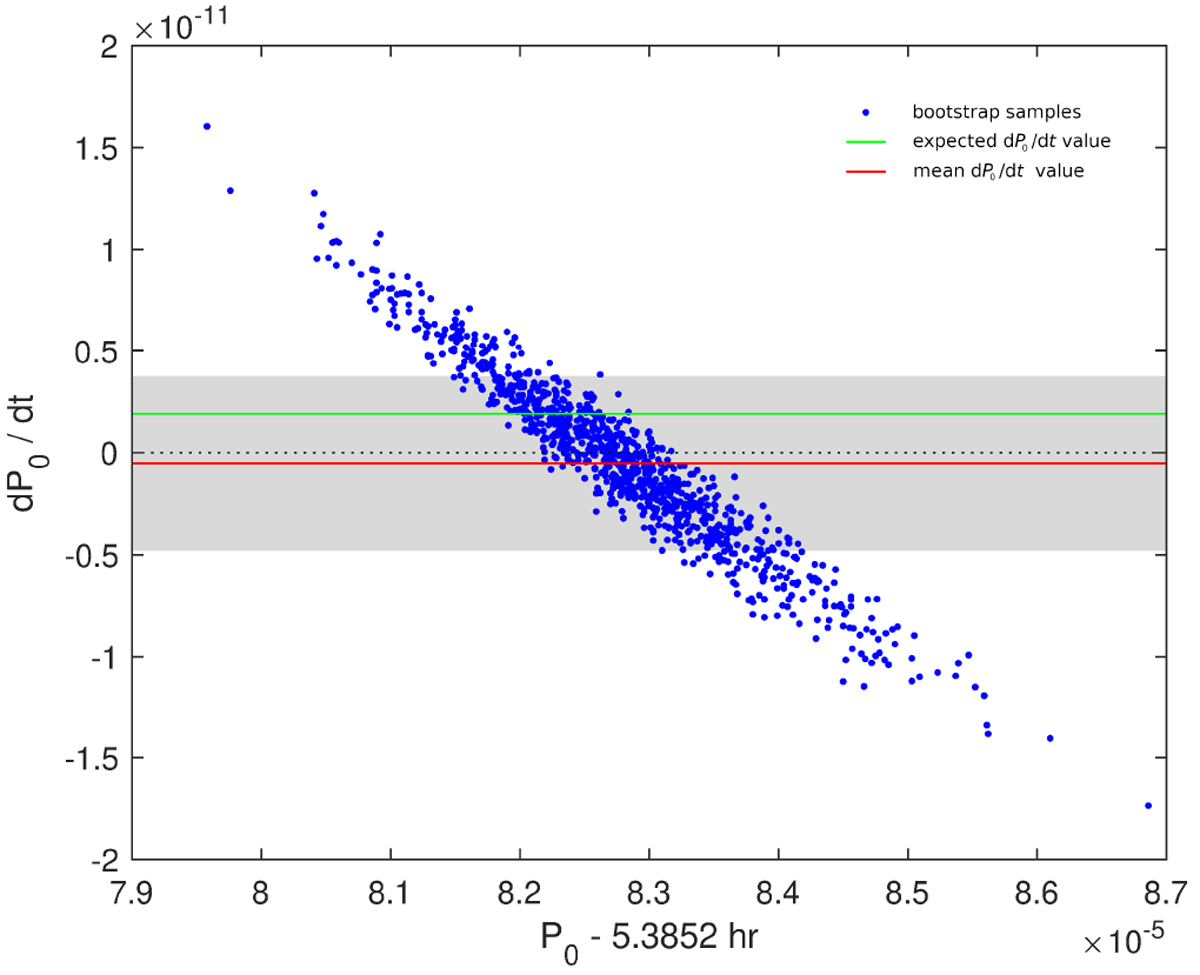
Period P0 and its change Ṗ0 for 1000 bootstrap samples of the photometric data set. Each blue point represents one bootstrap run. The mean value − 0.5 × 10⁻¹² of Ṗ0 is marked with a red line, and the theoretical prediction 1.9 × 10⁻¹² of Kleopatra’s deceleration due to tides is marked with the green line. The grey strip marks the 1σ uncertainty interval for Ṗ.
Current usage metrics show cumulative count of Article Views (full-text article views including HTML views, PDF and ePub downloads, according to the available data) and Abstracts Views on Vision4Press platform.
Data correspond to usage on the plateform after 2015. The current usage metrics is available 48-96 hours after online publication and is updated daily on week days.
Initial download of the metrics may take a while.