Free Access
Fig. 4
Download original image
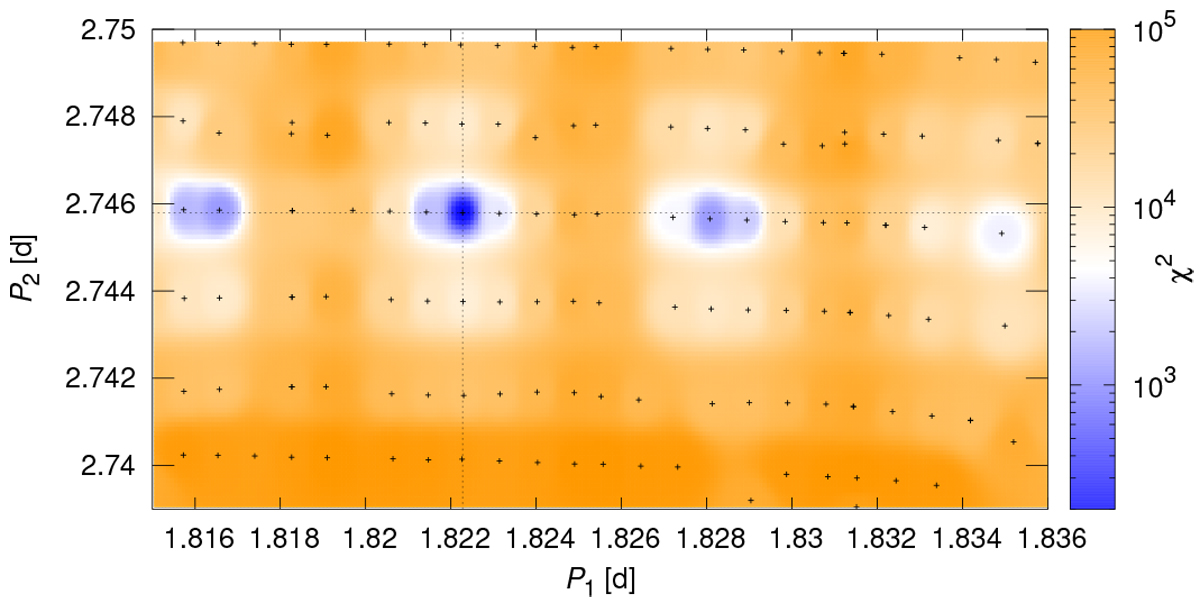
![]() values for a range of osculating periods P1, P2 and converged models. All black crosses correspond to local minima of χ2; colours are interpolated. A normal χ2 map would be much more irregular. The dotted lines show the periods of the global minimum.
values for a range of osculating periods P1, P2 and converged models. All black crosses correspond to local minima of χ2; colours are interpolated. A normal χ2 map would be much more irregular. The dotted lines show the periods of the global minimum.
Current usage metrics show cumulative count of Article Views (full-text article views including HTML views, PDF and ePub downloads, according to the available data) and Abstracts Views on Vision4Press platform.
Data correspond to usage on the plateform after 2015. The current usage metrics is available 48-96 hours after online publication and is updated daily on week days.
Initial download of the metrics may take a while.