Fig. 9
Download original image
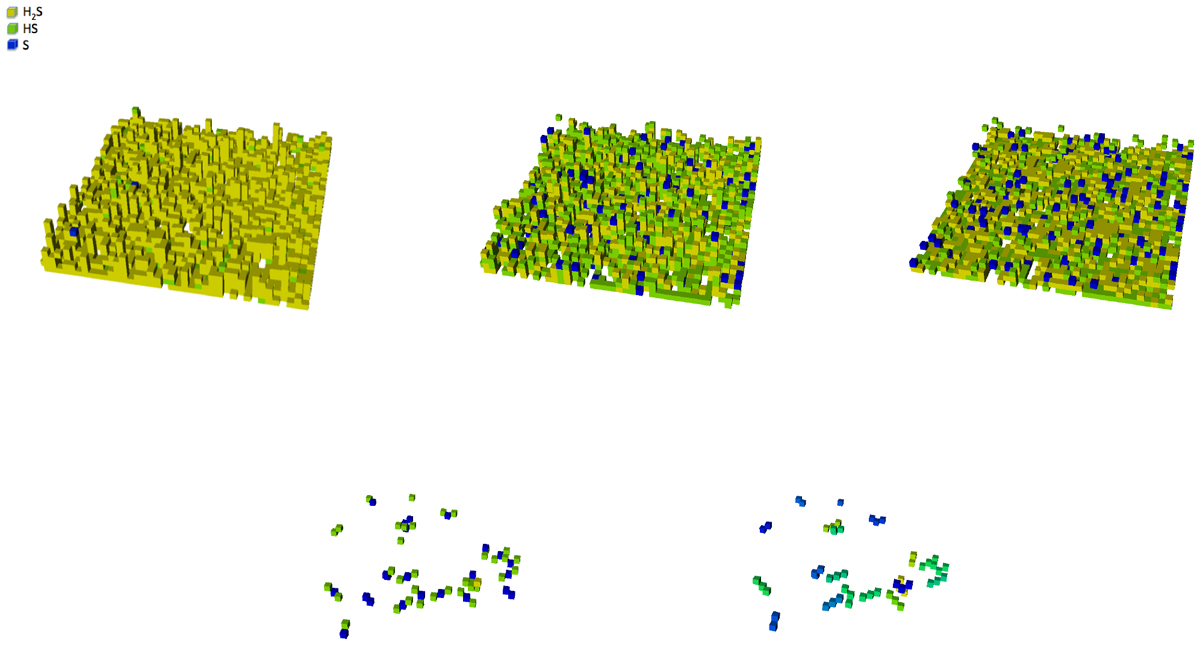
H2S on the surface after deposition at 8 K (top left) and during TPD at 50 K (top middle), at 100 K (top right), and at 150 K (bottom left).The bottom right panel also shows the surface at 150 K, but the chains are highlighted with one color per chain. In these simulations the molecules in the ice do shield each other and photons cannot dissociate molecules if they are under another molecule. The deposition rate of H2S is 1 ML s−1; the heating ramp is 1 K min−1 and G0 = 5 × 10⁶.
Current usage metrics show cumulative count of Article Views (full-text article views including HTML views, PDF and ePub downloads, according to the available data) and Abstracts Views on Vision4Press platform.
Data correspond to usage on the plateform after 2015. The current usage metrics is available 48-96 hours after online publication and is updated daily on week days.
Initial download of the metrics may take a while.