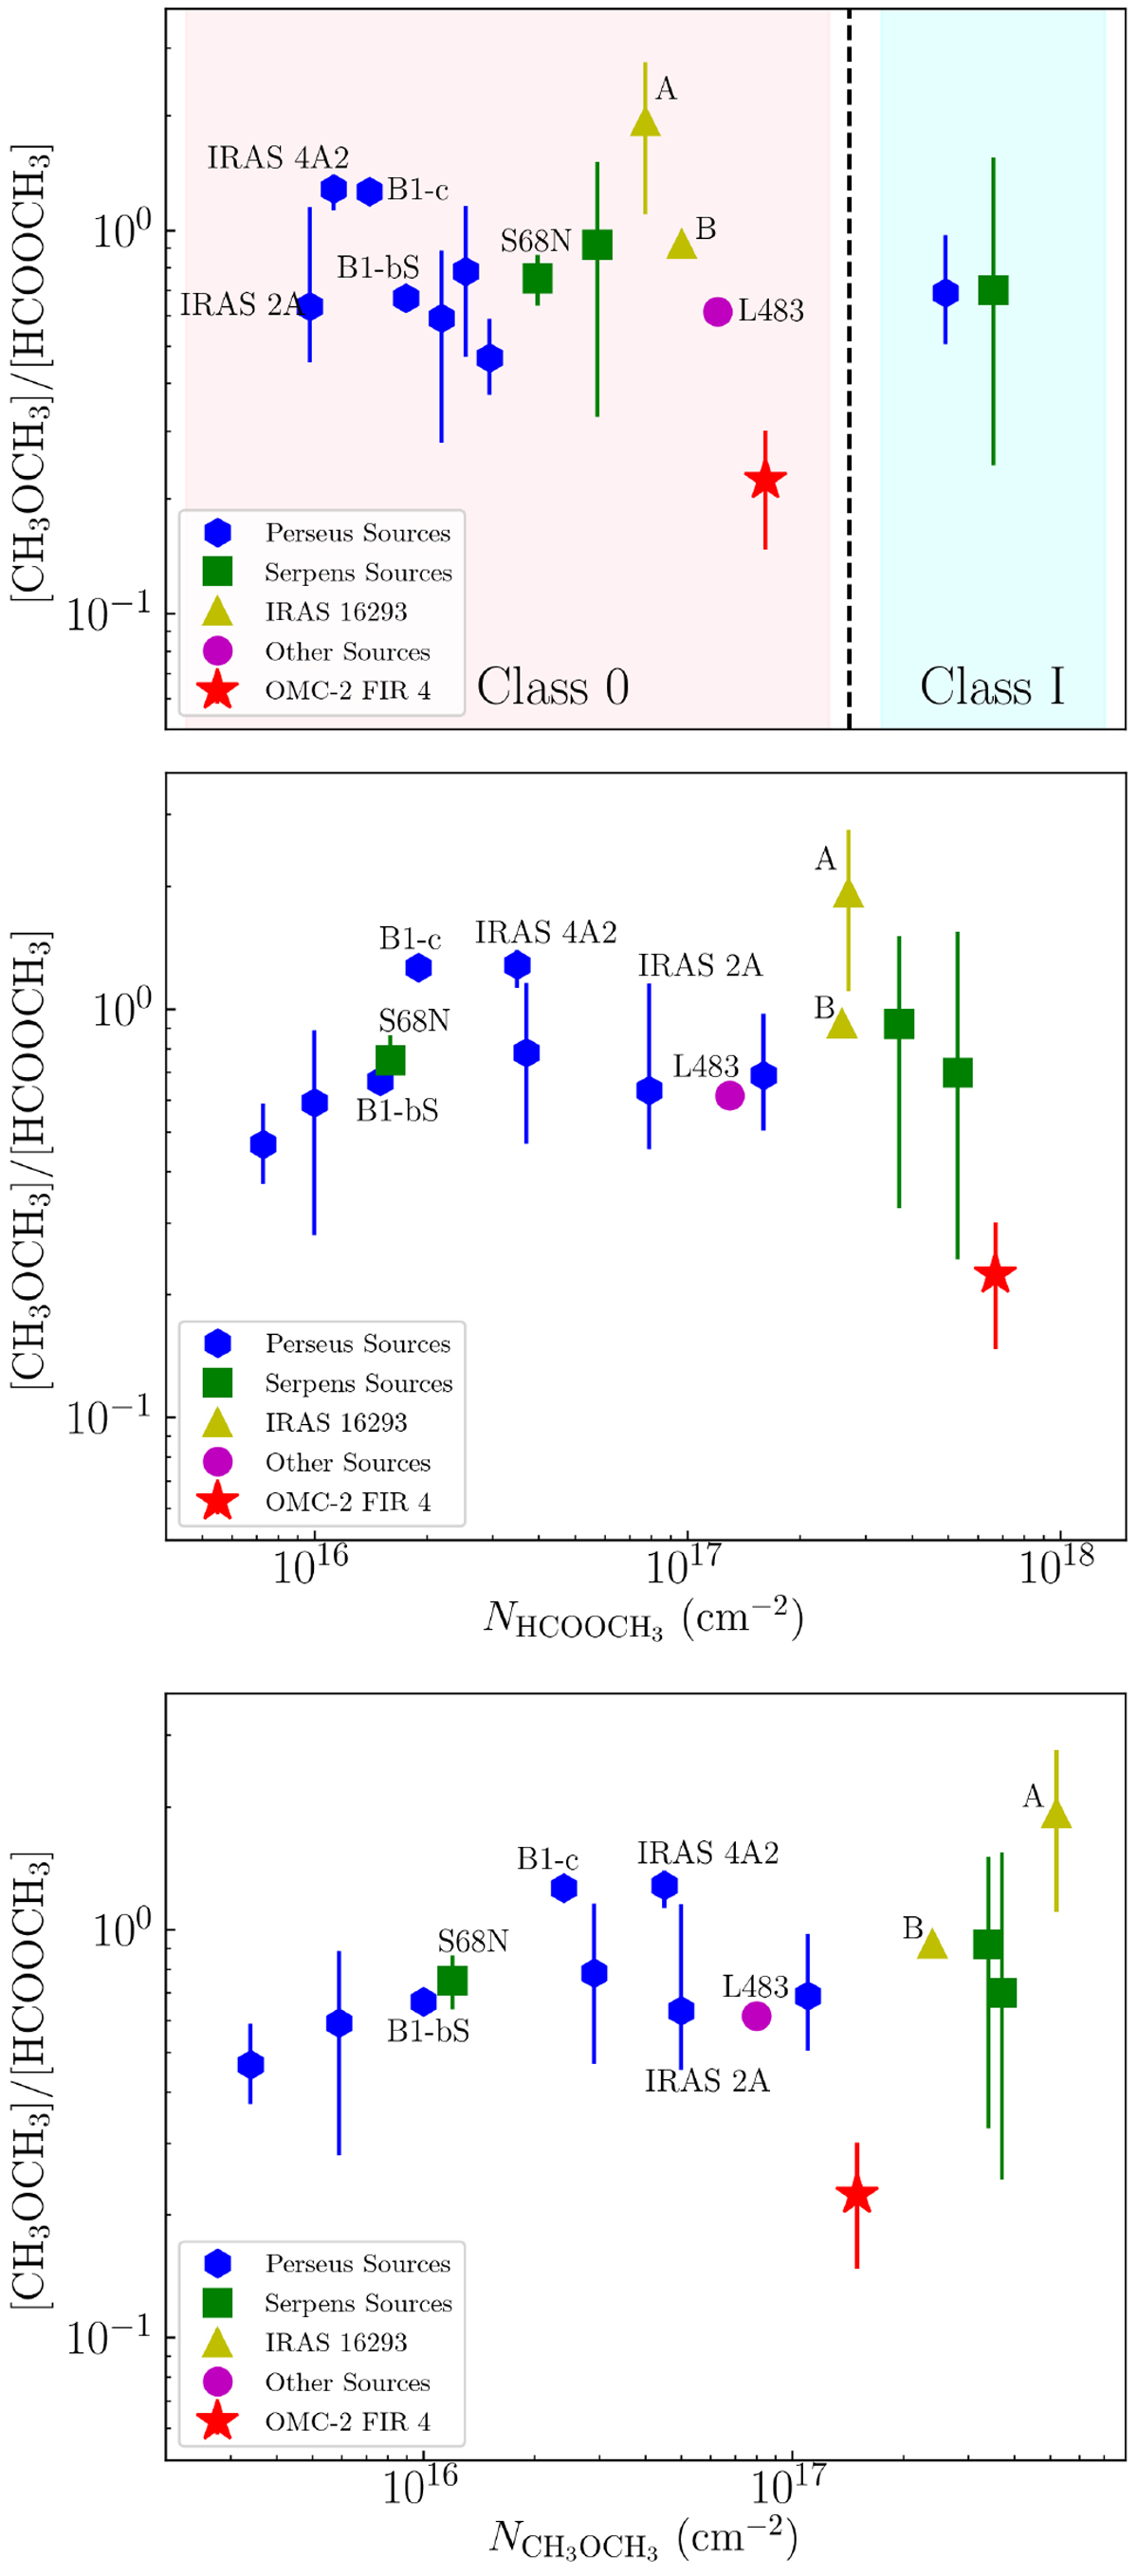
Fig. 5
Download original image
Abundance ratio of CH3OCH3 with respect to HCOOCH3 in HOPS-108 compared to other isolated hot corinos. In the top plot, the sources are separated according to their class, with no particular order within a given class. In the middle and bottom plots, the abundances are as a function of HCOOCH3 and CH3OCH3 column densities, respectively. The same sources from Fig. 4 are used, including B1-bS (Marcelino et al. 2018).
Current usage metrics show cumulative count of Article Views (full-text article views including HTML views, PDF and ePub downloads, according to the available data) and Abstracts Views on Vision4Press platform.
Data correspond to usage on the plateform after 2015. The current usage metrics is available 48-96 hours after online publication and is updated daily on week days.
Initial download of the metrics may take a while.