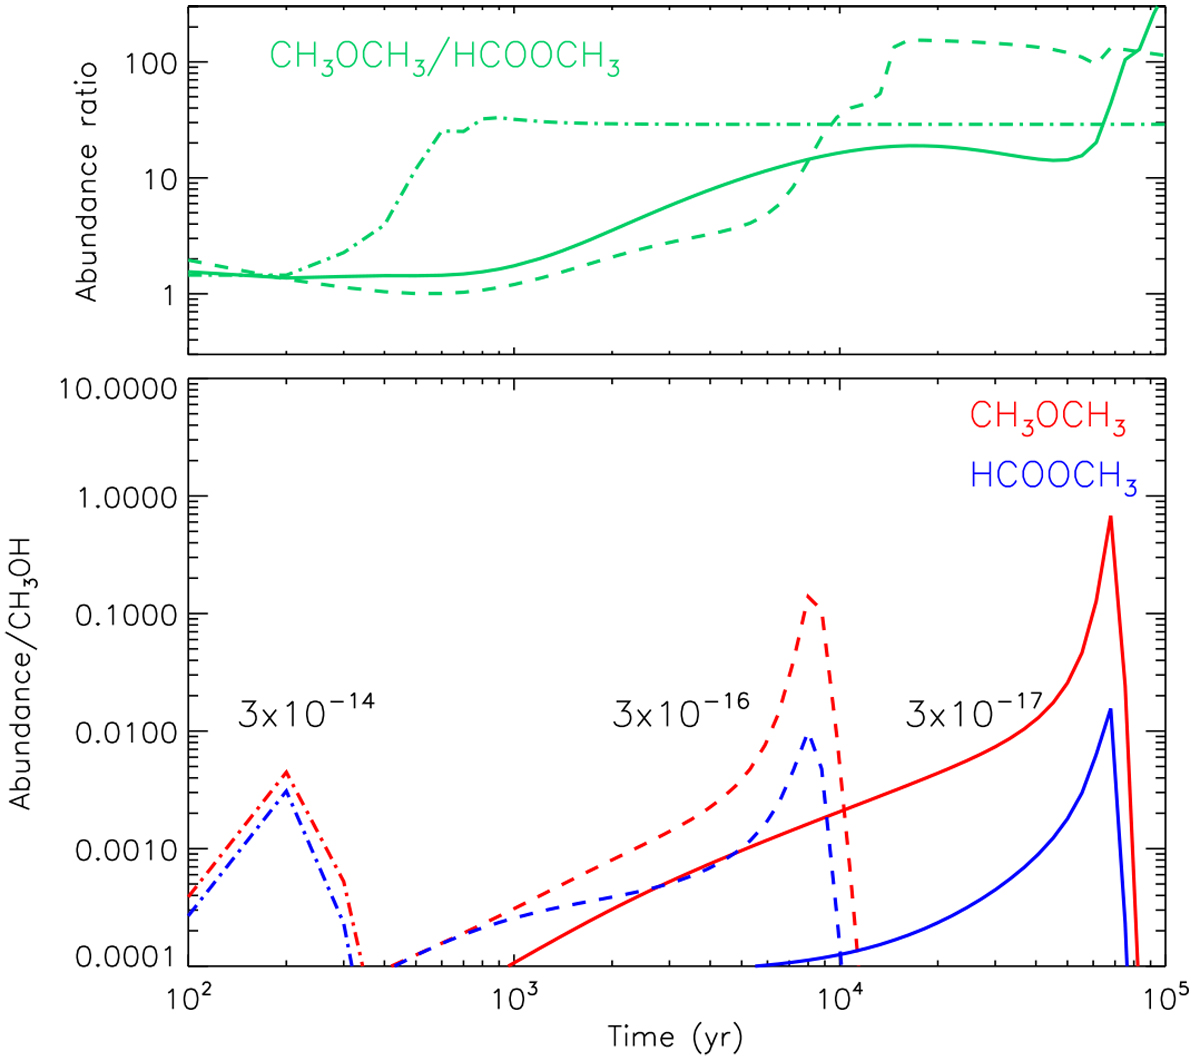
Fig. B.10
Download original image
Top: CH3OCH3/HCOOCH3 ratio as a function of time for different ionisation rate values (in units of s−1). Bottom: CH3OCH3 and HCOOCH3 abundances with respect to CH3OH as a functionof time for different ionisation rate values ζ. The ionisation rates in the upper and lower panel are the same: the solid lines correspond to ζ=3×10⁻¹⁷ s−1, the dashed lines correspond to ζ=3×10⁻¹⁶ s−1, and the dot-dashed lines correspond to ζ=3×10⁻¹⁴ s−1.
Current usage metrics show cumulative count of Article Views (full-text article views including HTML views, PDF and ePub downloads, according to the available data) and Abstracts Views on Vision4Press platform.
Data correspond to usage on the plateform after 2015. The current usage metrics is available 48-96 hours after online publication and is updated daily on week days.
Initial download of the metrics may take a while.