Fig. B.8
Download original image
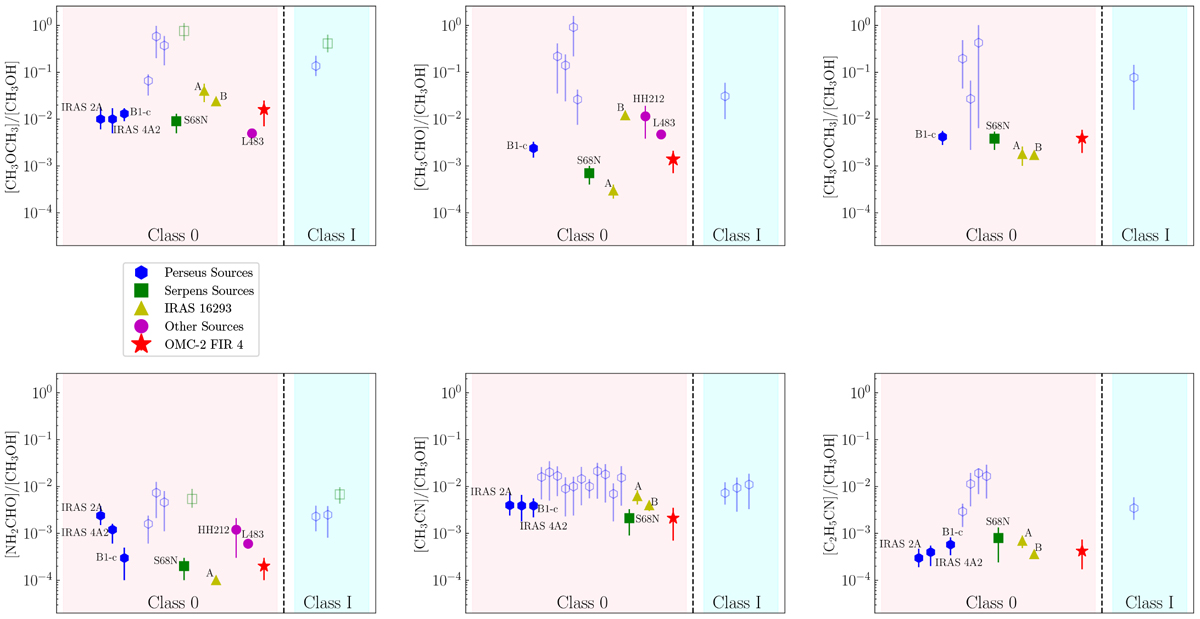
Abundance ratio of iCOMs with respect to CH3OH in HOPS-108 compared to other isolated hot corinos. The sources are separated according to their class, with no particular order within a given class. The open symbols correspond to the sources where the CH3OH column density is most likely underestimated due to its high optical depth (See Sect. 4.2.1). The Class 0 sources are: IRAS 2A, IRAS 4A2 (Taquet et al. 2015; López-Sepulcre et al. 2017), B1-c, S68N (van Gelder et al. 2020; Nazari et al. 2021), IRAS19347 + 0727 in B335 (Imai et al. 2016), HH212 (Bianchi et al. 2017; Lee et al. 2019), L483 (Jacobsen et al. 2019), Ser-emb 1 (Bergner et al. 2019), IRAS 16293 A (Manigand et al. 2020; Calcutt et al. 2018), IRAS 16293 B (Jørgensen et al. 2016, 2018; Lykke et al. 2017; Calcutt et al. 2018), HOPS-108 in OMC-2 FIR 4 (this work), and the sources from the PEACHES survey (Yang et al. 2021), including Per-emb 1, Per-emb 2, Per-emb 5, Per-emb 10, Per-emb 11A, Per-emb 11C, Per-emb 12, Per-emb 13, Per-emb 18, Per-emb 20, Per-emb 21, Per-emb 22A, Per-emb 22B, Per-emb 26, Per-emb 27, Per-emb 29, Per-emb 33A, L1448 IRS3A, L1448-NW, SVS-13B, and B1-bS. The Class I sources are: Ser-emb 17 (Bergner et al. 2019), L1551 (Bianchi et al. 2020), and also sources from the PEACHES survey (Yang et al. 2021), including Per-emb 35A, Per-emb 35B, Per-emb 42, Per-emb 44, Per-emb 53, and SVS13-A2. The same plots for HCOOCH3 and CH2DOH are represented in Figs. 4 and 6, respectively.
Current usage metrics show cumulative count of Article Views (full-text article views including HTML views, PDF and ePub downloads, according to the available data) and Abstracts Views on Vision4Press platform.
Data correspond to usage on the plateform after 2015. The current usage metrics is available 48-96 hours after online publication and is updated daily on week days.
Initial download of the metrics may take a while.