Fig. 7.
Download original image
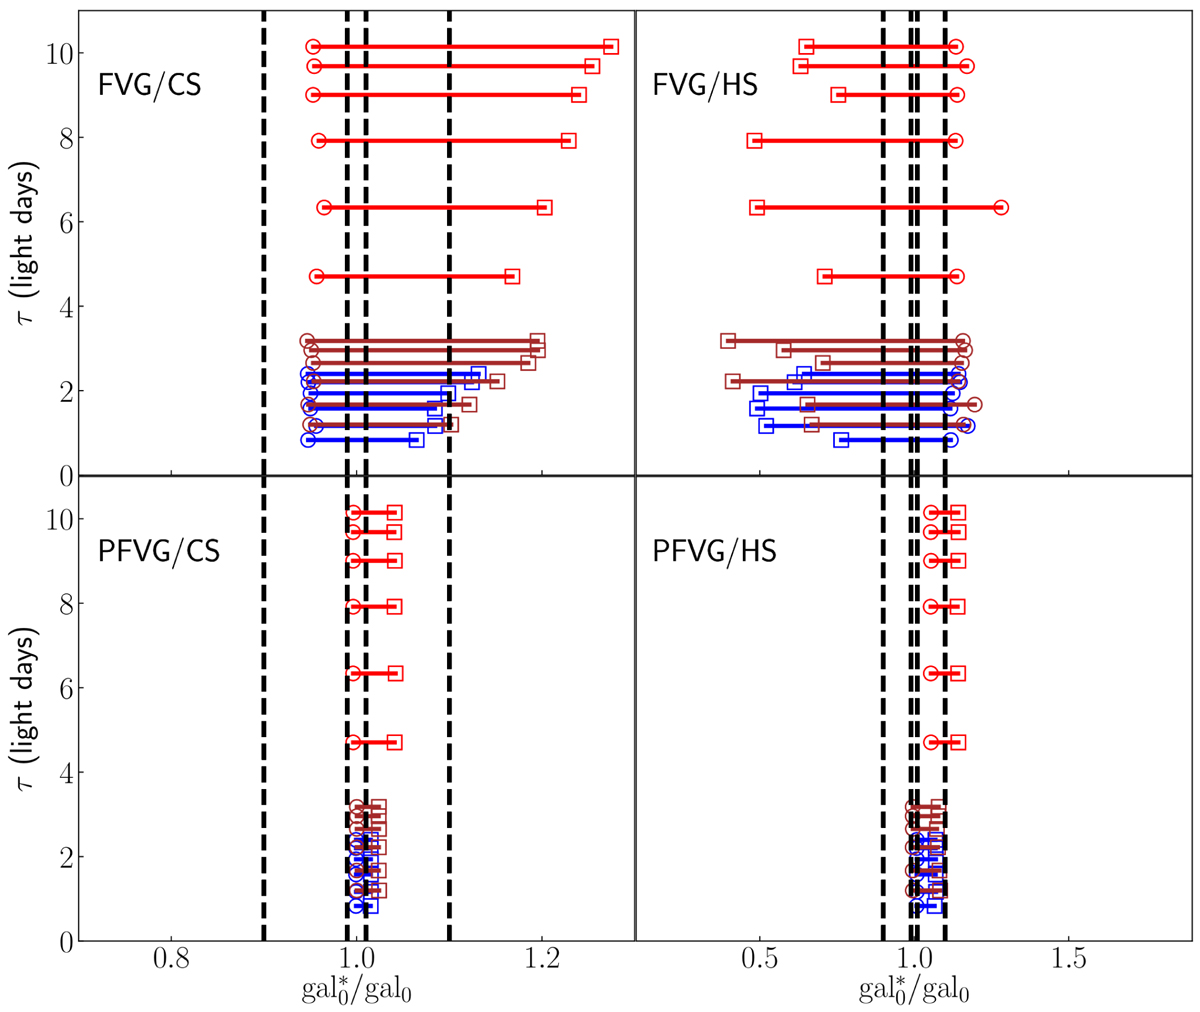
Distributions of host-galaxy fluxes (gal![]() ) obtained by the FVG (top) and PFVG (bottom) as a function of time delays. The distributions are shown for each object (in blue, brown, and red) obtained for different S/N, filters, and for a fixed time-sampling Δt = 3 days. The open circles and squares mark an S/N = 100 and 30, respectively. Dashed inner and outer lines represent 1 and 10% precision, respectively.
) obtained by the FVG (top) and PFVG (bottom) as a function of time delays. The distributions are shown for each object (in blue, brown, and red) obtained for different S/N, filters, and for a fixed time-sampling Δt = 3 days. The open circles and squares mark an S/N = 100 and 30, respectively. Dashed inner and outer lines represent 1 and 10% precision, respectively.
Current usage metrics show cumulative count of Article Views (full-text article views including HTML views, PDF and ePub downloads, according to the available data) and Abstracts Views on Vision4Press platform.
Data correspond to usage on the plateform after 2015. The current usage metrics is available 48-96 hours after online publication and is updated daily on week days.
Initial download of the metrics may take a while.