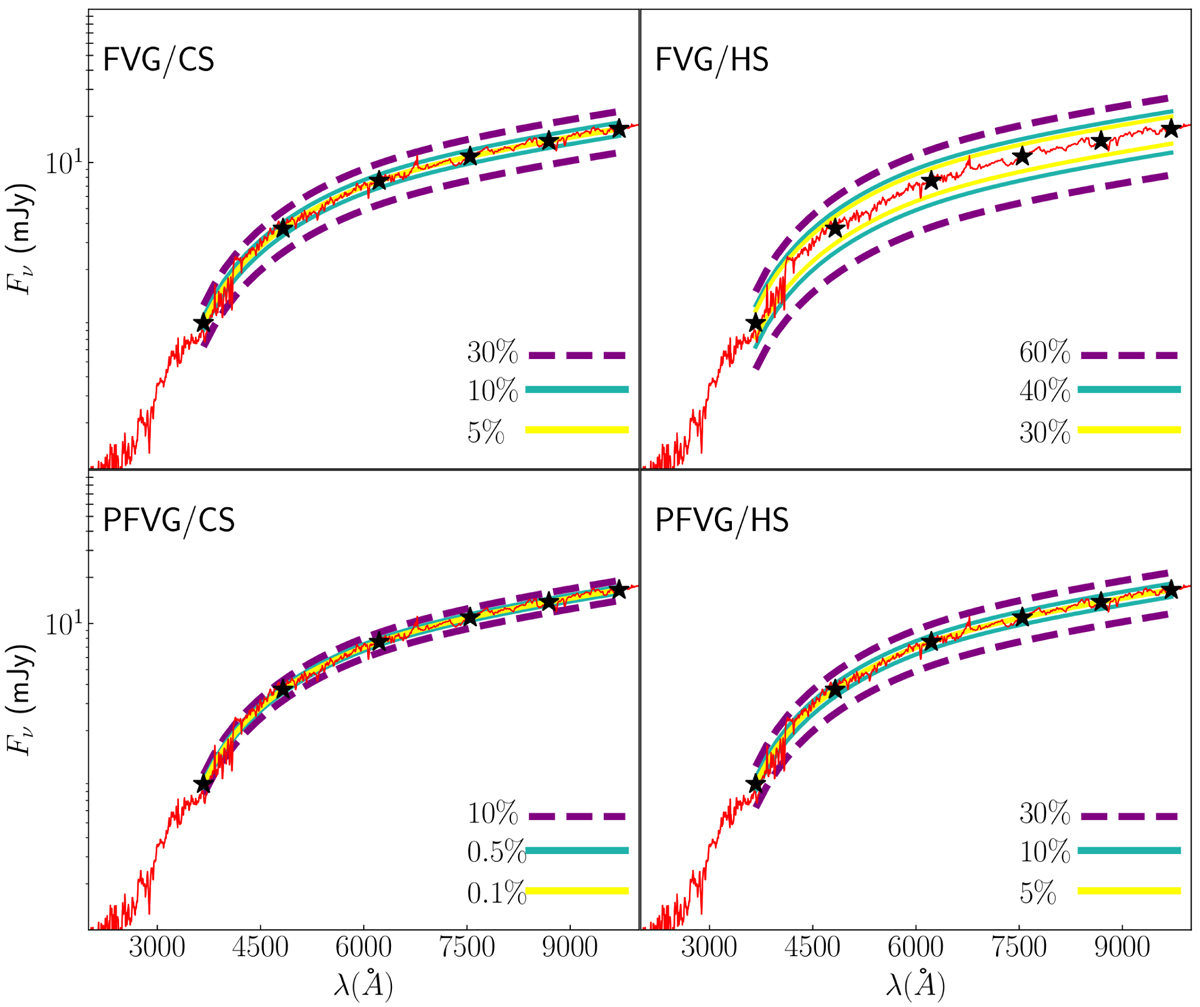
Fig. 5.
Download original image
Precision on the recovered galaxy fluxes obtained from the FVG (upper panels) and PFVG (lower panels) distributions for the CS and HS of AGN activity. The red line shows the Sa-type host-galaxy (observer’s frame) spectrum. The galaxy fluxes (in mJy) at each filter are plotted as filled black stars. The lines indicate the range of galaxy values that is recovered within the 68% confidence interval, and they are given for an S/N = 10 (purple), 100 (cyan), and 200 (yellow).
Current usage metrics show cumulative count of Article Views (full-text article views including HTML views, PDF and ePub downloads, according to the available data) and Abstracts Views on Vision4Press platform.
Data correspond to usage on the plateform after 2015. The current usage metrics is available 48-96 hours after online publication and is updated daily on week days.
Initial download of the metrics may take a while.