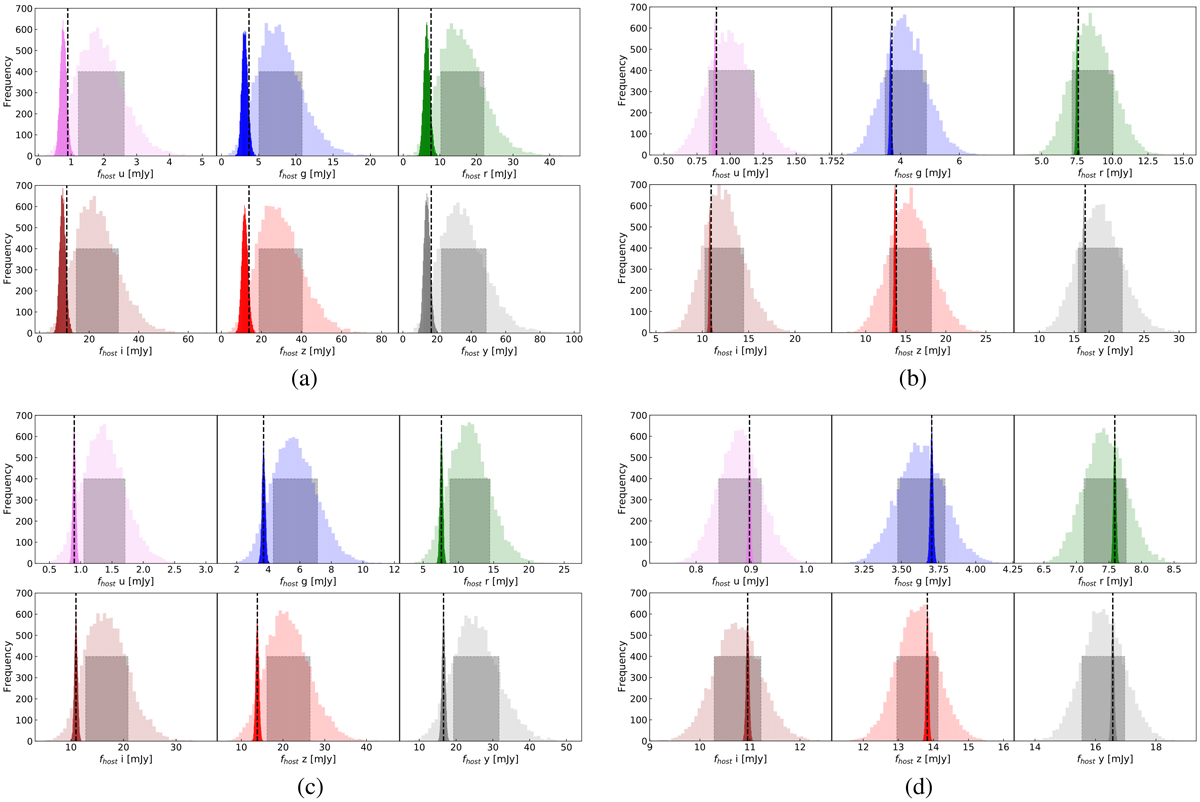
Fig. 4.
Download original image
Recovered PFVG distributions (see Eq. (10)) of host-galaxy fluxes obtained for the HS (transparent colored histogram) and CS (solid colored histogram). Distributions obtained for poorly sampled light curves, with low and high S/N, are shown in panels a and b, respectively. Distributions obtained for well-sampled light curves, with low and high S/N, are shown in panels c and d, respectively. The vertical dotted line marks the true galaxy value used in the simulations (gal0). The 68% confidence range used to estimate the 1σ uncertainty around the median is shown as transparent black boxes. (a) S/N = 10, Δt = 10 days. (b) S/N = 100, Δt = 10 days. (c) S/N = 10, Δt = 1 days. (d) S/N = 100, Δt = 1 days.
Current usage metrics show cumulative count of Article Views (full-text article views including HTML views, PDF and ePub downloads, according to the available data) and Abstracts Views on Vision4Press platform.
Data correspond to usage on the plateform after 2015. The current usage metrics is available 48-96 hours after online publication and is updated daily on week days.
Initial download of the metrics may take a while.