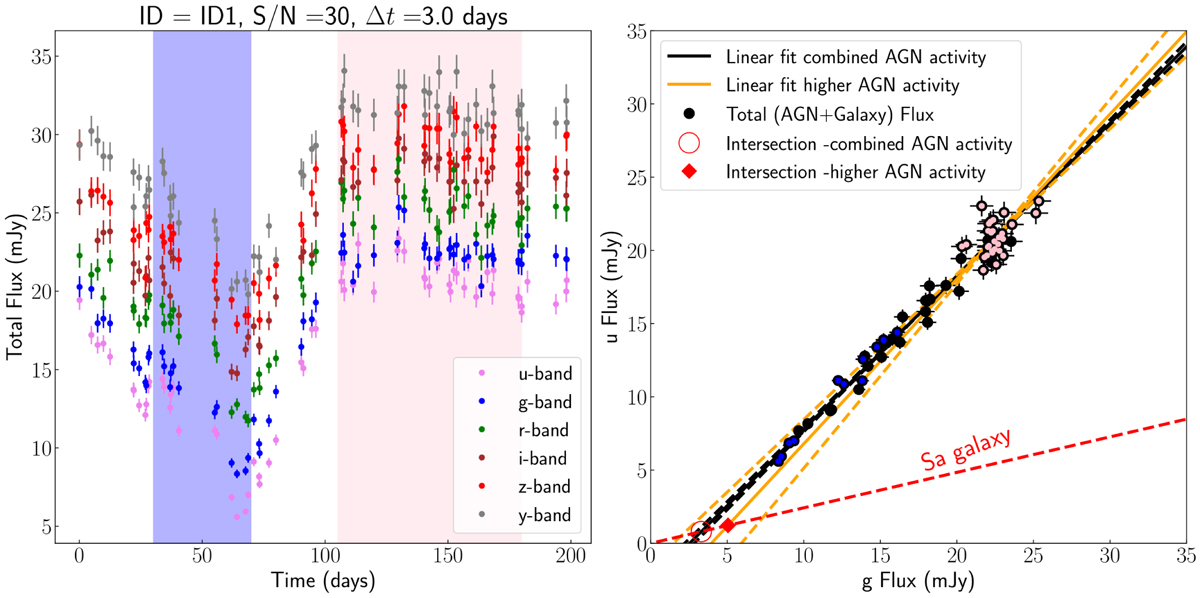
Fig. 2.
Download original image
Flux variation gradient applied to set of light curves from our LSST mock catalog. Left panel: light curves with an average time sampling of Δt = 3 days, S/N = 30, and total time span of T = 200 days. Low and high levels of AGN activity are marked with blue and magenta circles, respectively. Right panel: FVG analysis for the u and g bands only. Other bands are given in Fig. A.2. The dotted orange and black lines cover the upper and lower standard deviations of the OLS bisector fit (solid lines) for the combined (black) and higher (orange) AGN state of activity. The color of the Sa galaxy we used in the simulations is shown as a dotted red line.
Current usage metrics show cumulative count of Article Views (full-text article views including HTML views, PDF and ePub downloads, according to the available data) and Abstracts Views on Vision4Press platform.
Data correspond to usage on the plateform after 2015. The current usage metrics is available 48-96 hours after online publication and is updated daily on week days.
Initial download of the metrics may take a while.