Free Access
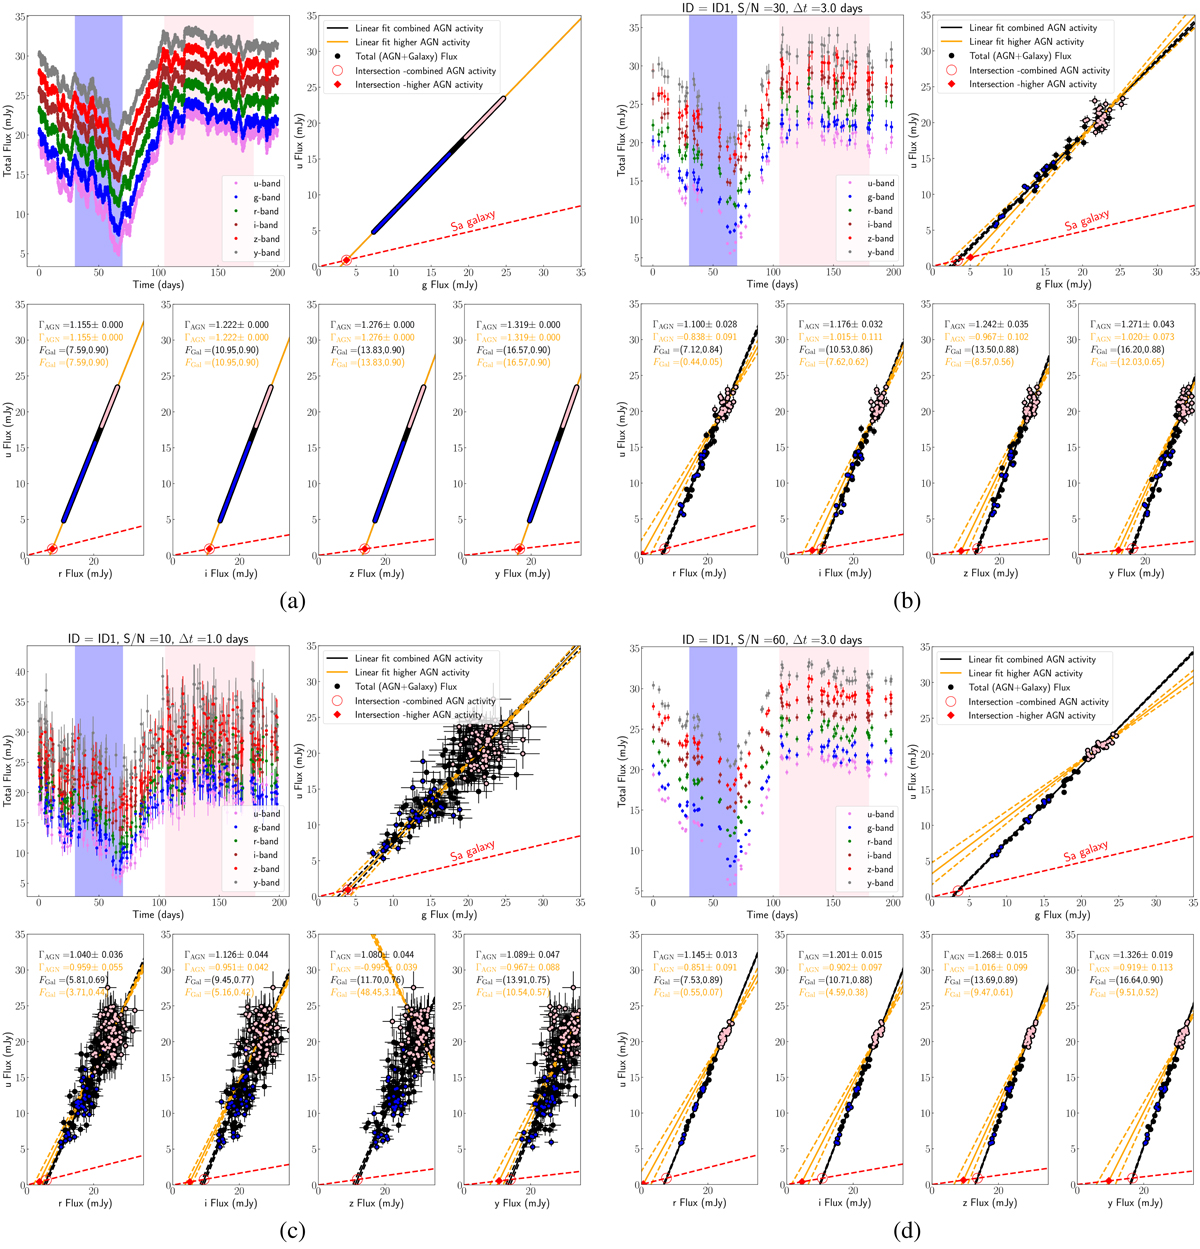
Fig. A.2.
Download original image
FVG for the LSST-simulated light curves from our mock catalog. Panel (a) shows the FVG results obtained for the ideal noiseless light curve with a time sampling of 0.1 days. Panels (b), (c), and (d) show the FVG results for light curves of varying quality.
Current usage metrics show cumulative count of Article Views (full-text article views including HTML views, PDF and ePub downloads, according to the available data) and Abstracts Views on Vision4Press platform.
Data correspond to usage on the plateform after 2015. The current usage metrics is available 48-96 hours after online publication and is updated daily on week days.
Initial download of the metrics may take a while.