Fig. A.1.
Download original image
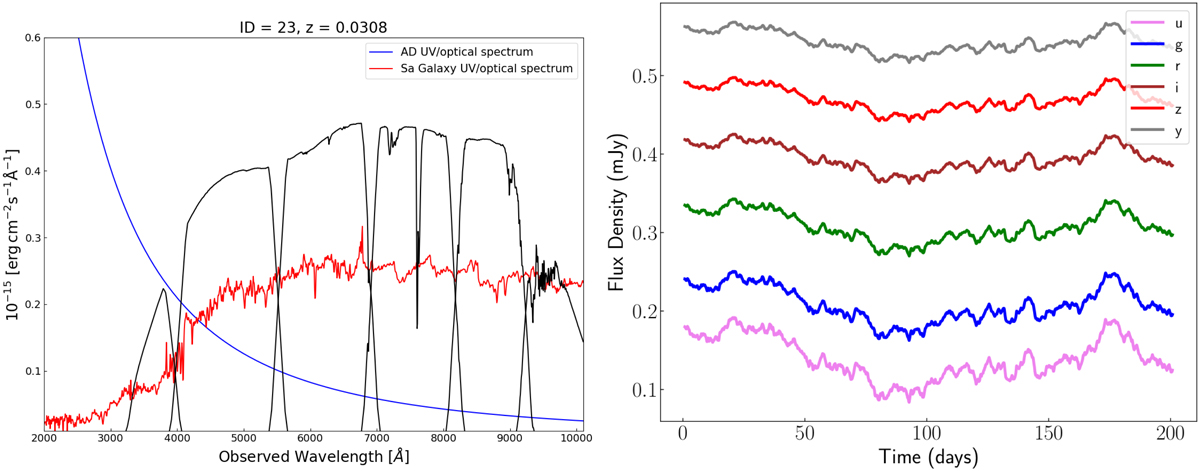
Example of a simulated UV/Optical AGN spectrum (solid blue line, left) along with a Sa-type host-galaxy template (solid red line). The transmission curves of the LSST broadband filters are shown with solid black lines (ugrizy; from left to right). In this particular case, the host galaxy contributes about 50% of the total flux at 5100 Å (rest frame). Flux-calibrated light curves resulting from the convolution between each LSST broadband filter with the AGN and galaxy components (right).
Current usage metrics show cumulative count of Article Views (full-text article views including HTML views, PDF and ePub downloads, according to the available data) and Abstracts Views on Vision4Press platform.
Data correspond to usage on the plateform after 2015. The current usage metrics is available 48-96 hours after online publication and is updated daily on week days.
Initial download of the metrics may take a while.