Fig. 1.
Download original image
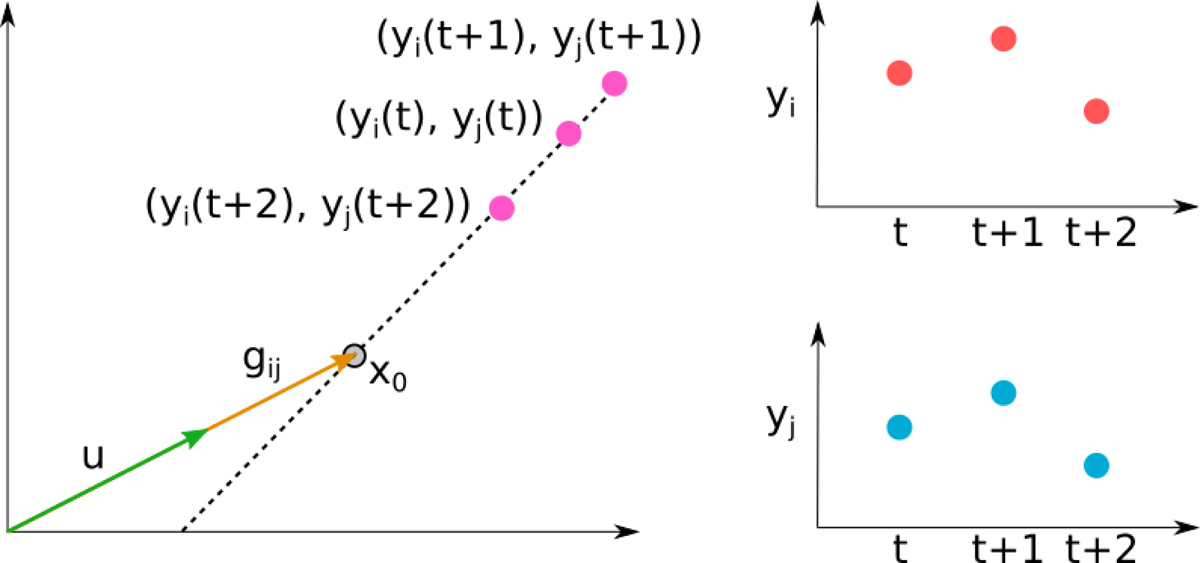
Sketch of FVG. Observations in filters i and j measured at three different time instances (right). By pairing flux values of co-occurring observations, we form points in the flux-flux plot that fall on a line (dashed). Vector gij (in brown) corresponds to the unobserved host-galaxy and defines a line gij ⋅ x that intersects the dashed line at x0, the point of (unobserved) minimum AGN activity. The FVG method consists of finding the intersection of u ⋅ x and the dashed line; u (in green) is a vector that has the same direction (i.e., same colors) as gij and therefore also intersects the dashed line at x0.
Current usage metrics show cumulative count of Article Views (full-text article views including HTML views, PDF and ePub downloads, according to the available data) and Abstracts Views on Vision4Press platform.
Data correspond to usage on the plateform after 2015. The current usage metrics is available 48-96 hours after online publication and is updated daily on week days.
Initial download of the metrics may take a while.