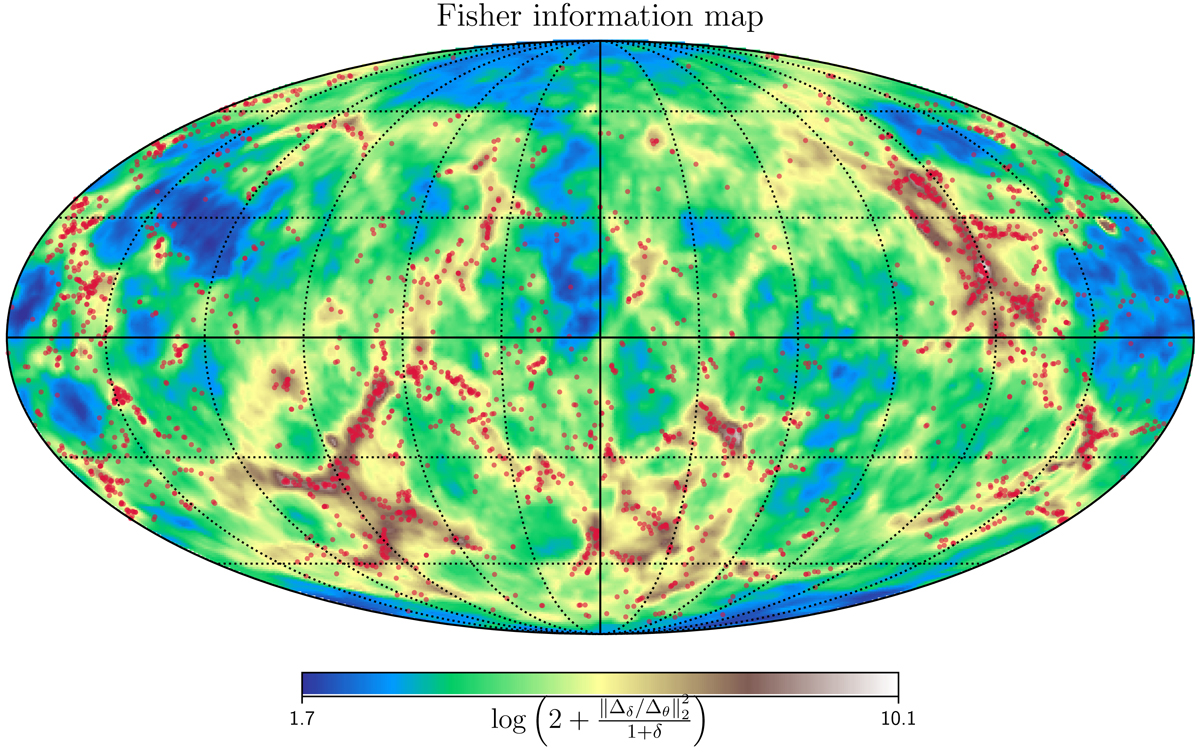
Fig. 3.
Download original image
Fisher information map for the same spherical slice as in Fig. 2. The observed galaxy distribution from the 2M++ catalog, lying in the corresponding spherical shell centered around the observer, is represented by the red dots. We find that the regions in the vicinity of the massive cosmic structures, as traced by the galaxy distribution, are the most informative according to the Fisher information map. These regions correspond to the regime of gravitational infall of the galaxy clusters.
Current usage metrics show cumulative count of Article Views (full-text article views including HTML views, PDF and ePub downloads, according to the available data) and Abstracts Views on Vision4Press platform.
Data correspond to usage on the plateform after 2015. The current usage metrics is available 48-96 hours after online publication and is updated daily on week days.
Initial download of the metrics may take a while.