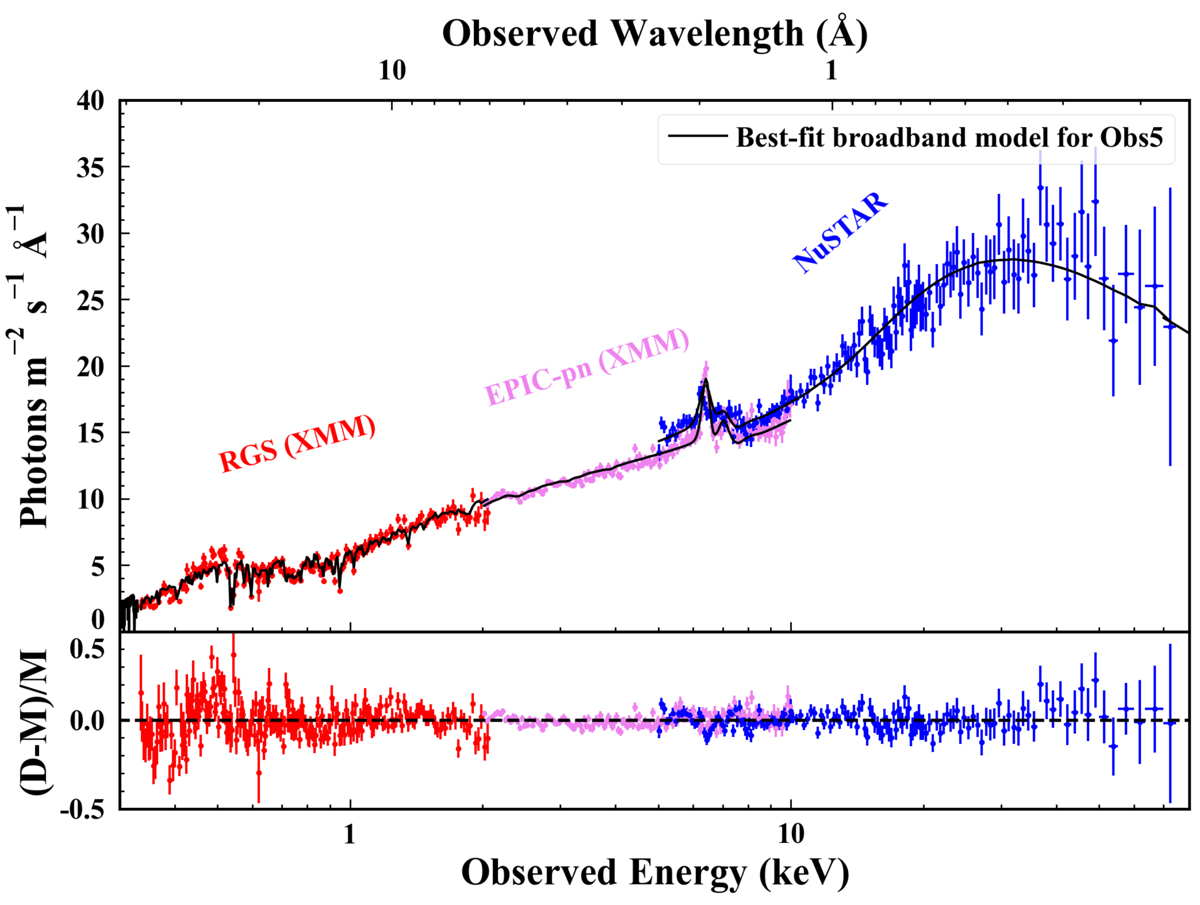
Fig. 3.
Download original image
Observational data (colored data points) with the best-fit broadband SED model in the X-ray band (black solid curve) for Obs5 (top panel). Residuals of the best-fit model (“D” is the observational data and “M” is the best-fit model) for Obs5 (bottom panel). Obs5 is given as an example (other observations have similar fitting results).
Current usage metrics show cumulative count of Article Views (full-text article views including HTML views, PDF and ePub downloads, according to the available data) and Abstracts Views on Vision4Press platform.
Data correspond to usage on the plateform after 2015. The current usage metrics is available 48-96 hours after online publication and is updated daily on week days.
Initial download of the metrics may take a while.