Fig. 2.
Download original image
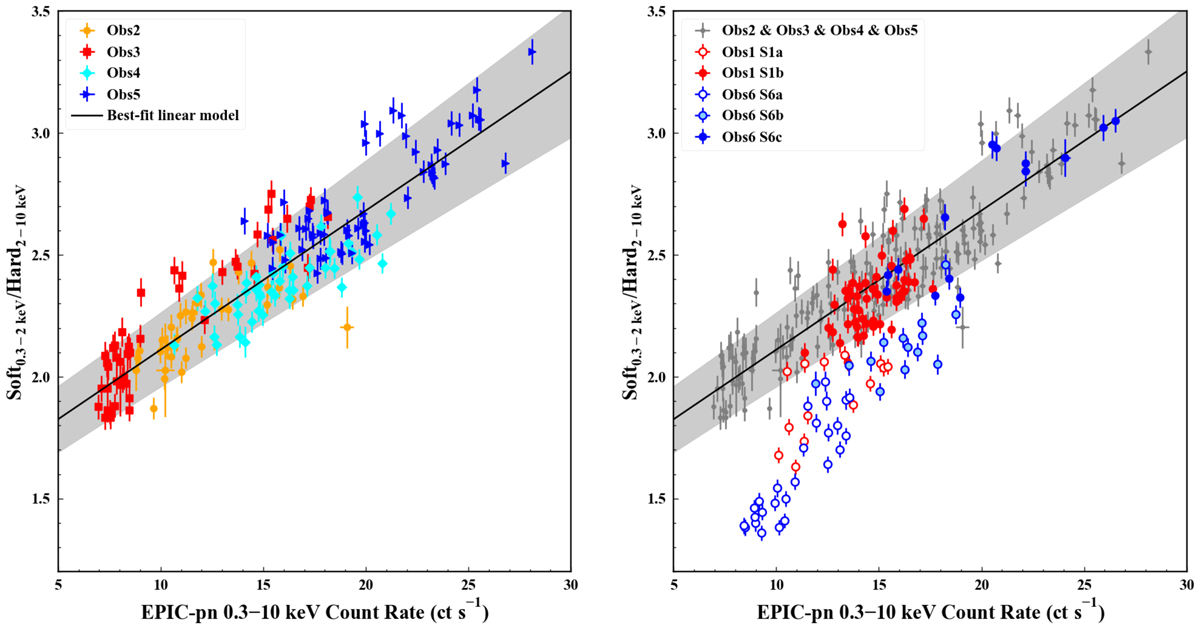
Correlation between the softness ratio (the ratio of count rates between 0.3−2 and 2−10 keV bands), and 0.3−10 keV count rate, for Obs2 to Obs5 (left panel), and for Obs1 and Obs6 (right panel). In both left and right panels, the black solid line is the best-fit linear model of y = (0.06 ± 0.01)x + (1.54 ± 0.13) for Obs2 to Obs5. The shaded grey region is the associated 1σ uncertainty.
Current usage metrics show cumulative count of Article Views (full-text article views including HTML views, PDF and ePub downloads, according to the available data) and Abstracts Views on Vision4Press platform.
Data correspond to usage on the plateform after 2015. The current usage metrics is available 48-96 hours after online publication and is updated daily on week days.
Initial download of the metrics may take a while.