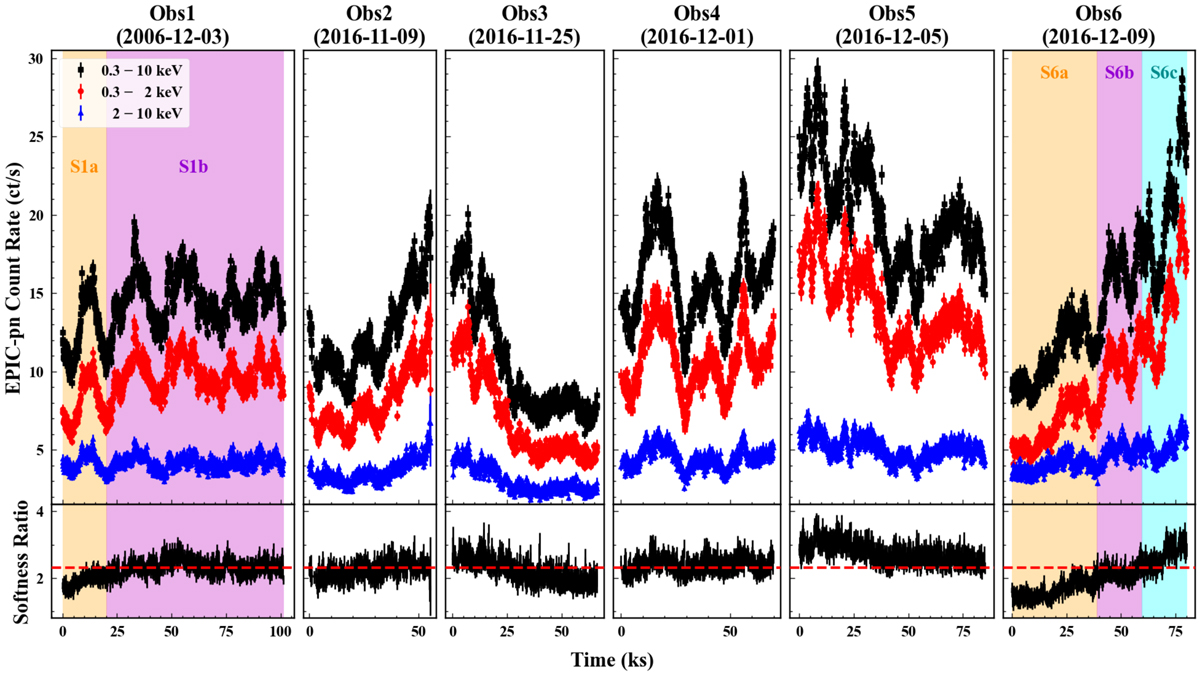
Fig. 1.
Download original image
XMM-Newton/EPIC-pn light curves (red points: 0.3−2 keV; blue points: 2−10 keV; black points: 0.3−10 keV) of NGC 3227 (top panel) and softness ratio curves between the count rates in 0.3−2 keV and 2−10 keV bands (Soft0.3 − 2 keV/Hard2 − 10 keV; bottom panel) with the time bin of 100 s. The red horizontal dashed line in the bottom panel is the average softness ratio of all the six observations. According to the difference between the softness ratio of each observation (black points in the bottom panel) and the average softness ratio (horizontal dashed line in red), Obs1 is divided into two slices that are S1a (orange region of the first column) and S1b (violet region of the first column), and Obs6 is divided into three slices that are S6a (orange region of the last column), S6b (violet region of the last column), and S6c (cyan region of the last column).
Current usage metrics show cumulative count of Article Views (full-text article views including HTML views, PDF and ePub downloads, according to the available data) and Abstracts Views on Vision4Press platform.
Data correspond to usage on the plateform after 2015. The current usage metrics is available 48-96 hours after online publication and is updated daily on week days.
Initial download of the metrics may take a while.