Fig. 3.
Download original image
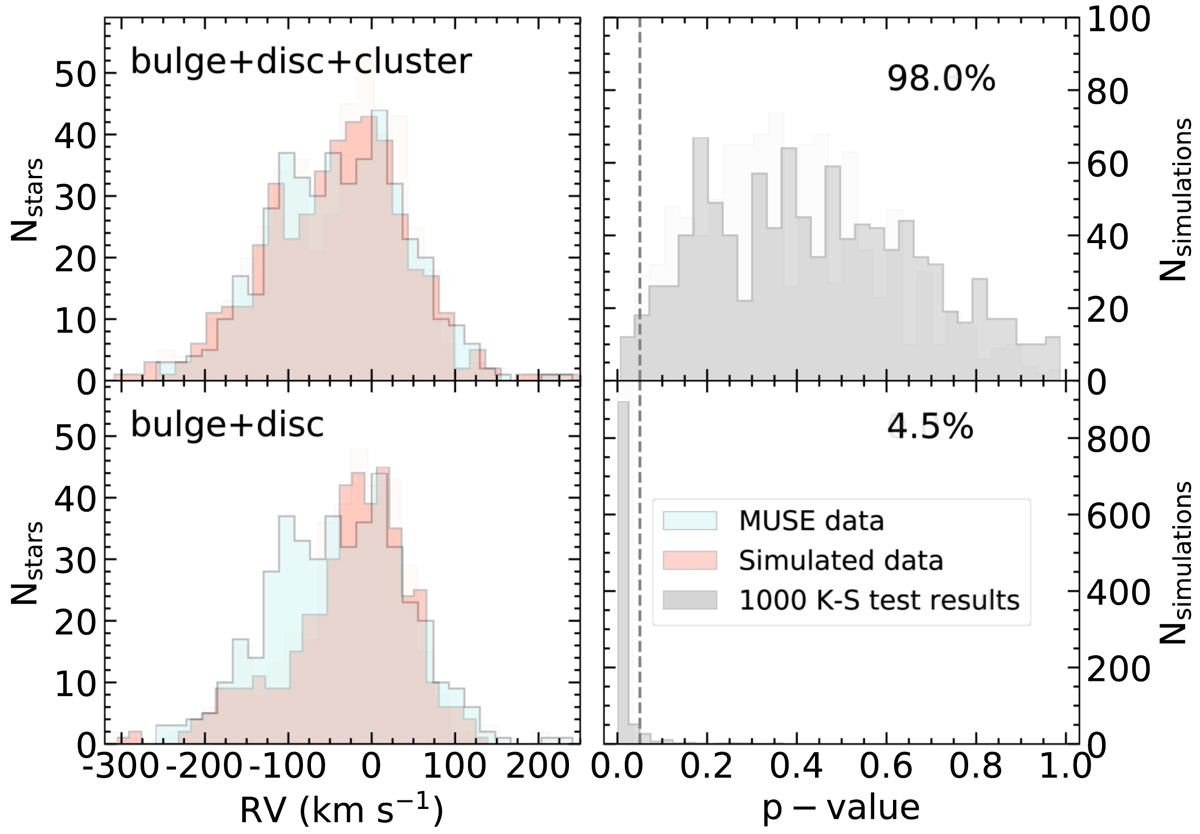
Comparison of the MUSE RV distribution with simulations. Left panels: MUSE RV distribution compared to an example of simulated RV distribution with and without considering the cluster. Right panels: distribution of p-values resulting from the comparison of 1000 simulated RV distributions with those from the MUSE data. The dashed line indicates p-value = 0.05 and the percentage refers to the fraction of simulations resulting in p-value > 0.05.
Current usage metrics show cumulative count of Article Views (full-text article views including HTML views, PDF and ePub downloads, according to the available data) and Abstracts Views on Vision4Press platform.
Data correspond to usage on the plateform after 2015. The current usage metrics is available 48-96 hours after online publication and is updated daily on week days.
Initial download of the metrics may take a while.