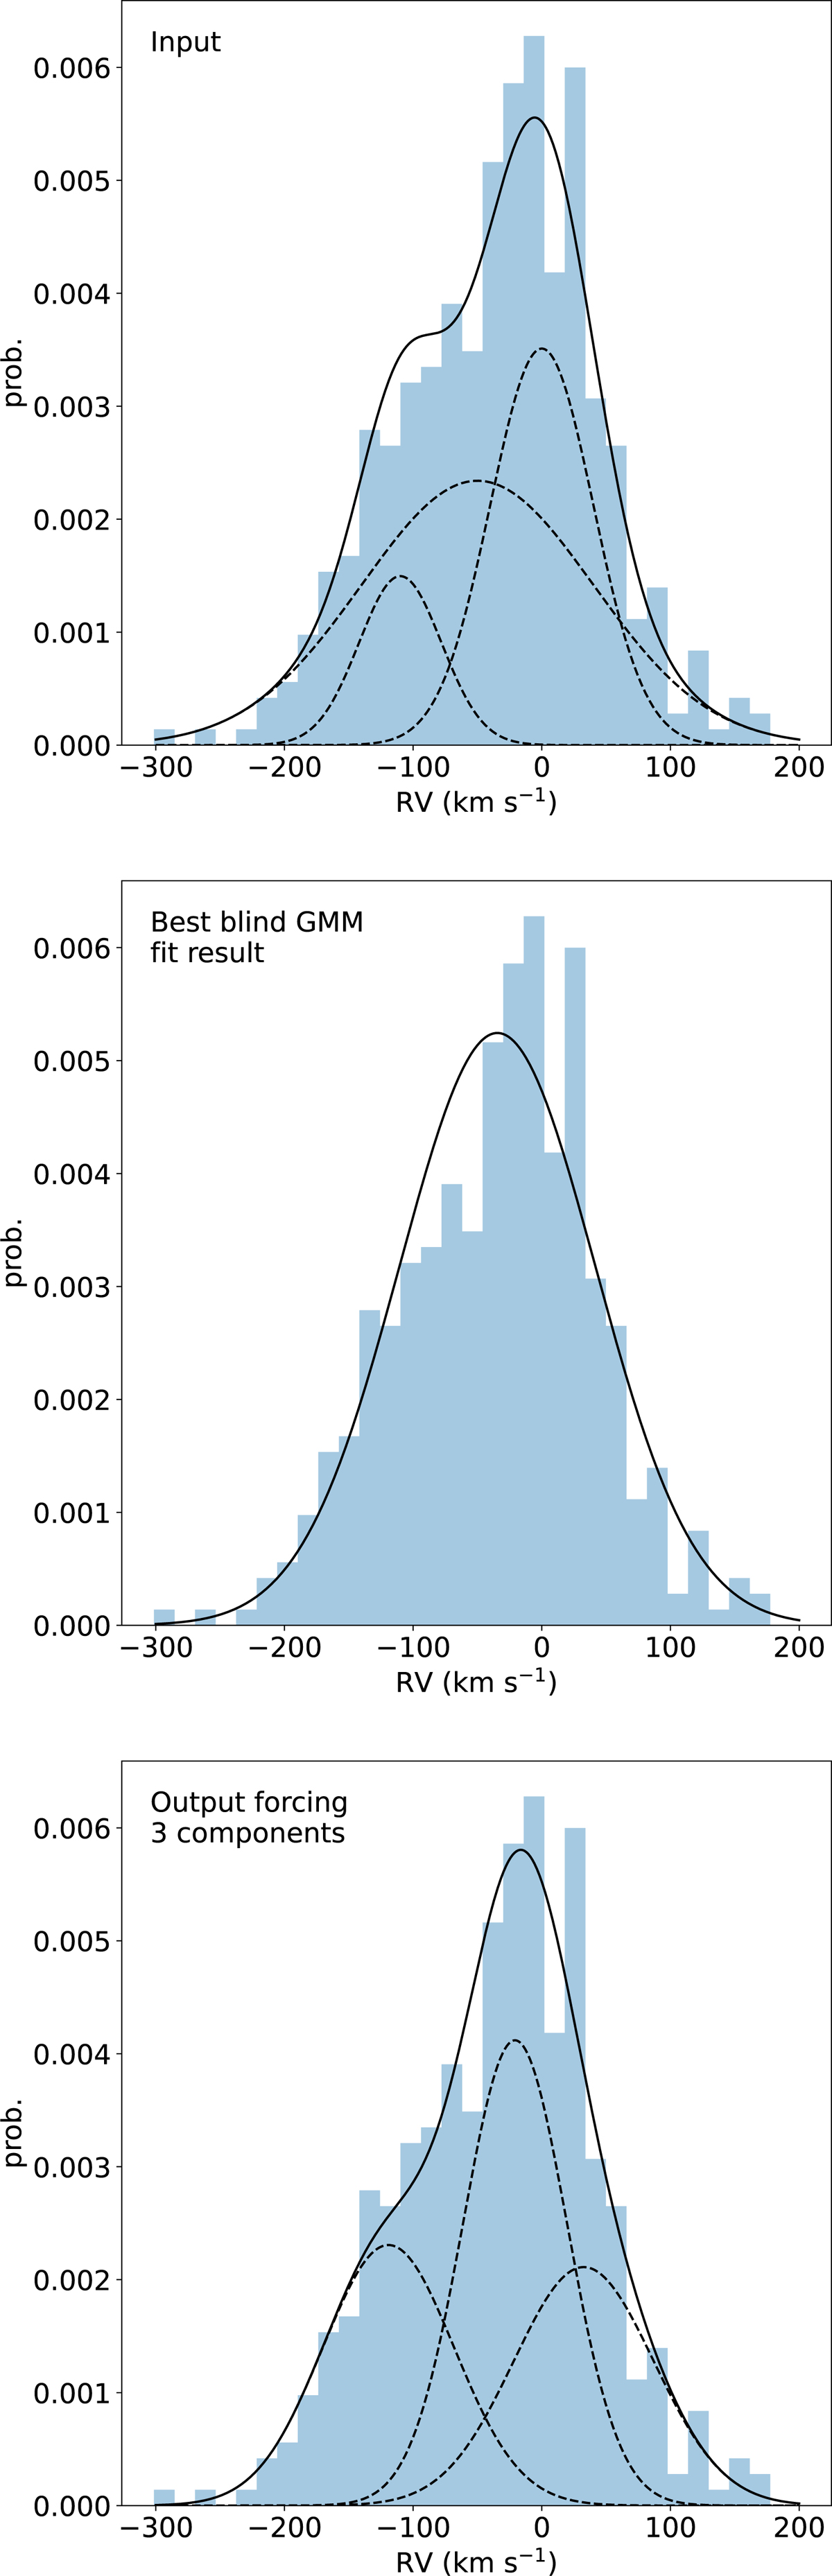
Fig. B.1.
Download original image
GMM fitting results for a simulated distribution of 450 stars with three RV components with the mean and dispersion adopted for bulge and disc, and that derived for FSR 1776. The top panel shows the input Gaussians that represent the bulge, disc, and cluster used to generate the histogram (in blue). The middle panel shows the best result with (RV,σ) =(−34, 54) km s−1. The bottom panel shows the result forcing the GMM to find three components: (RV, σ, fraction) =(−21, 29, 42%), (33, 38, 29%), (−119, 36, 29%) km s−1.
Current usage metrics show cumulative count of Article Views (full-text article views including HTML views, PDF and ePub downloads, according to the available data) and Abstracts Views on Vision4Press platform.
Data correspond to usage on the plateform after 2015. The current usage metrics is available 48-96 hours after online publication and is updated daily on week days.
Initial download of the metrics may take a while.