Free Access
Fig. 1.
Download original image
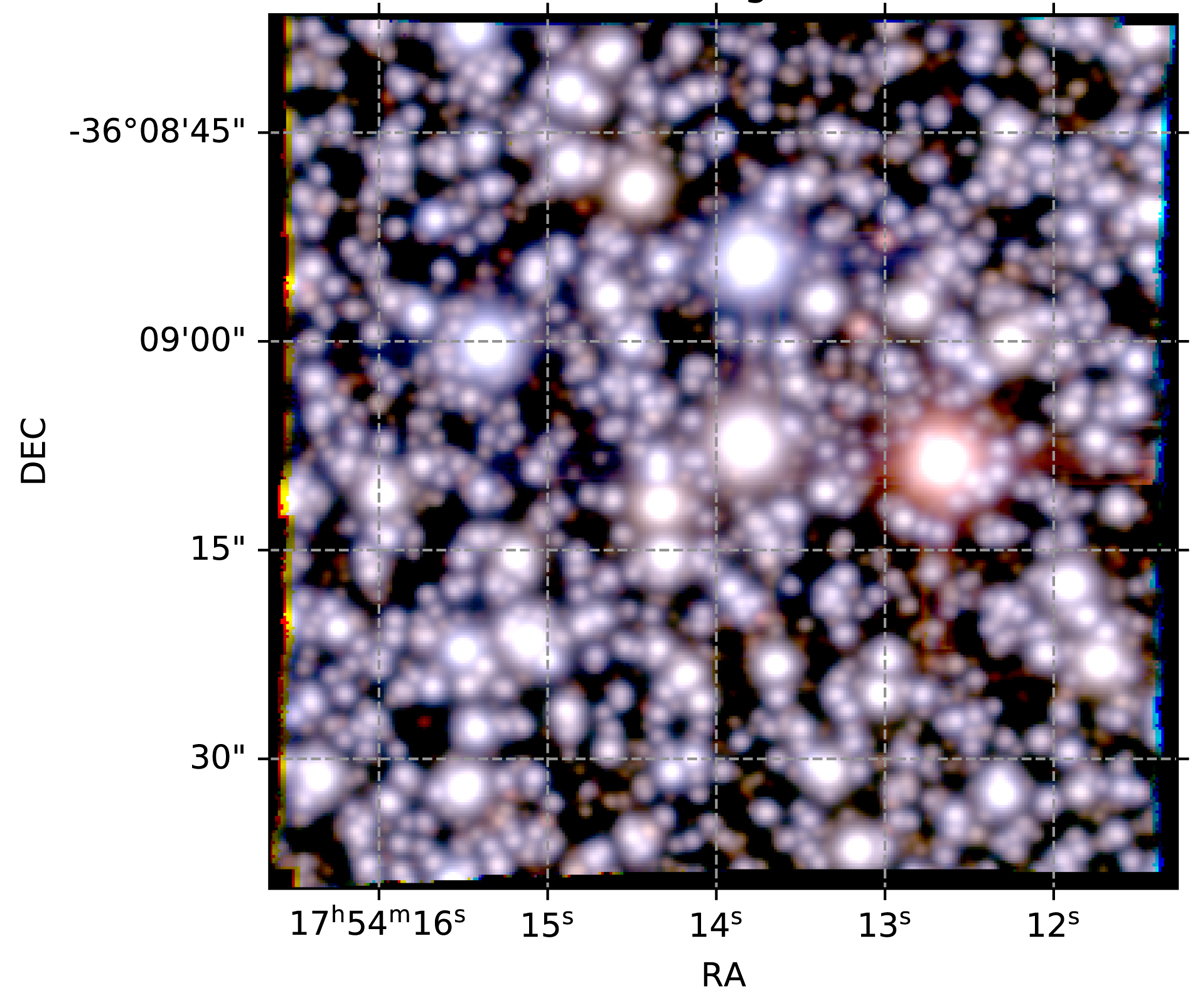
Composite coloured image of the MUSE data cube. The original images were taken by convolving the transmission curves of the DECam filters g, r, i with the MUSE cubes. The full field of view of 1′×1′ is shown. The flux scale is a hyperbolic sine to enhance fainter stars, which are important in the present analysis.
Current usage metrics show cumulative count of Article Views (full-text article views including HTML views, PDF and ePub downloads, according to the available data) and Abstracts Views on Vision4Press platform.
Data correspond to usage on the plateform after 2015. The current usage metrics is available 48-96 hours after online publication and is updated daily on week days.
Initial download of the metrics may take a while.