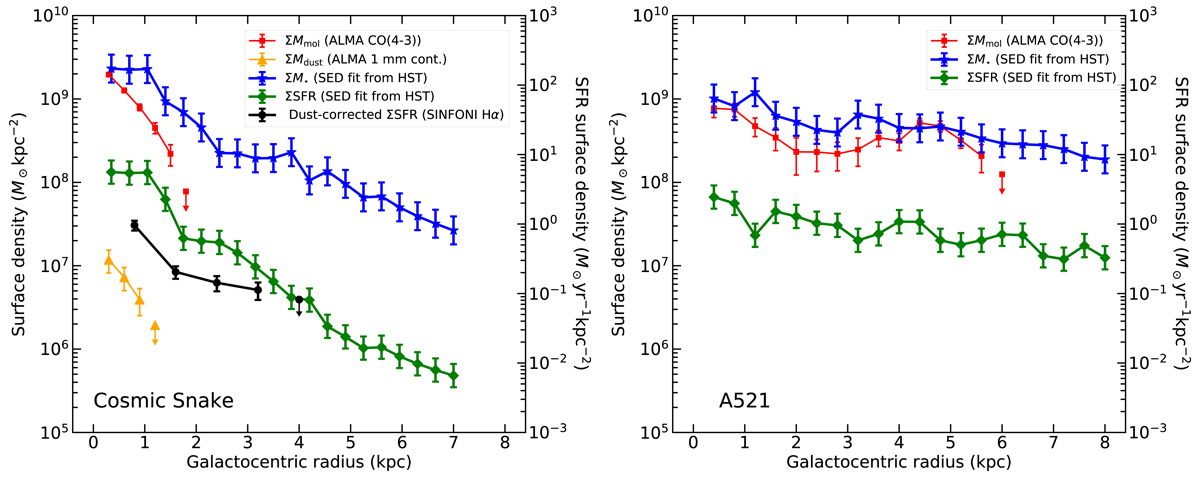
Fig. 7.
Download original image
Radial profiles of the Cosmic Snake (left panel) and A521 (right panel). The blue lines trace the ΣM⋆ profile, the red and orange lines trace the ΣMmol and ΣMdust profiles, and the green and black lines trace the ΣSFR radial profiles from the SED fits and the Hα emission, respectively. We consider as detection a signal above 4σ for the ALMA data and above 2σ for the other data. We indicate with an upper limit the datapoint below the corresponding detection threshold.
Current usage metrics show cumulative count of Article Views (full-text article views including HTML views, PDF and ePub downloads, according to the available data) and Abstracts Views on Vision4Press platform.
Data correspond to usage on the plateform after 2015. The current usage metrics is available 48-96 hours after online publication and is updated daily on week days.
Initial download of the metrics may take a while.