Fig. 1.
Download original image
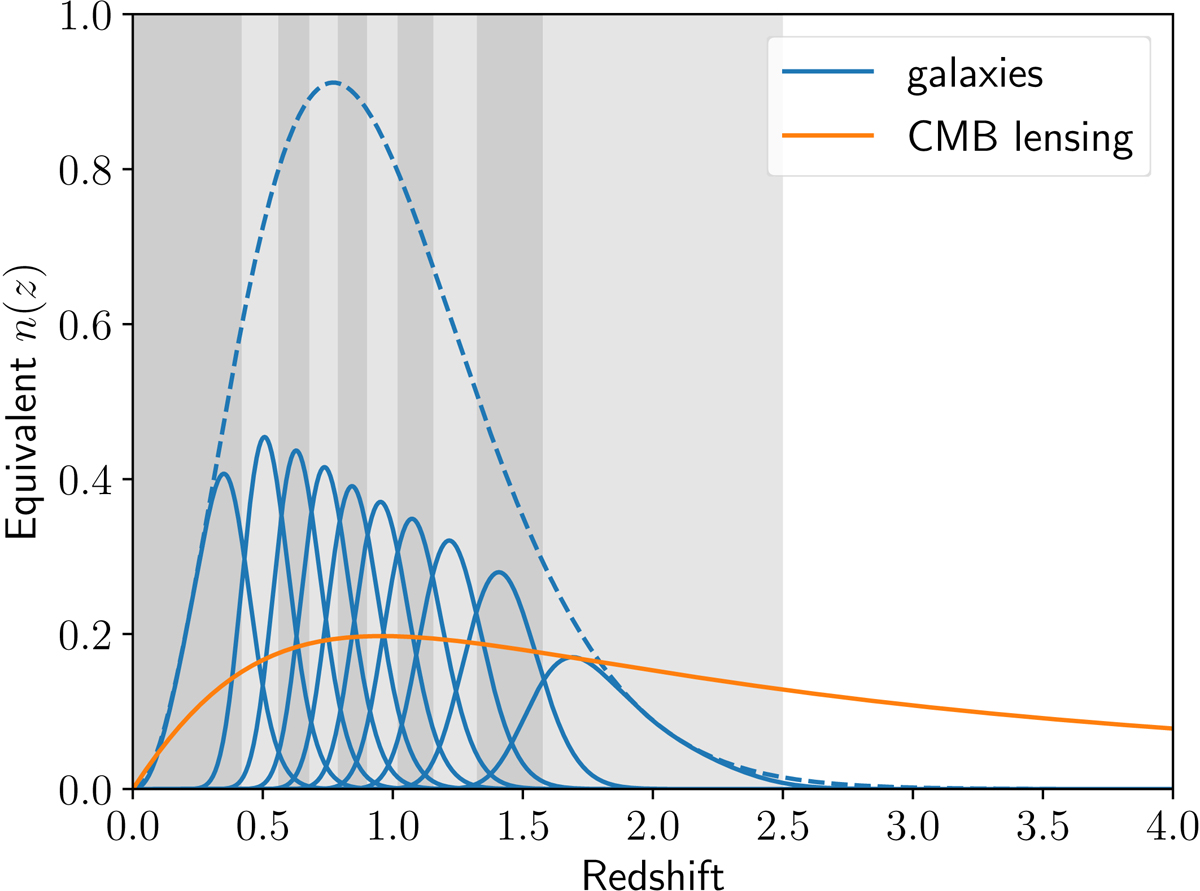
Redshift distribution (normalised to unit area) assumed for the galaxies of the Euclid photometric sample in dashed blue; the grey bands indicate the ten (observed) redshift bins used in the analysis, and the solid blue curves show the ten corresponding true underlying redshift distributions. The solid orange curve shows the equivalent redshift distribution (also normalised to unit area) derived from the CMB lensing kernel of Eq. (14) for our fiducial cosmological model.
Current usage metrics show cumulative count of Article Views (full-text article views including HTML views, PDF and ePub downloads, according to the available data) and Abstracts Views on Vision4Press platform.
Data correspond to usage on the plateform after 2015. The current usage metrics is available 48-96 hours after online publication and is updated daily on week days.
Initial download of the metrics may take a while.