Fig. 5.
Download original image
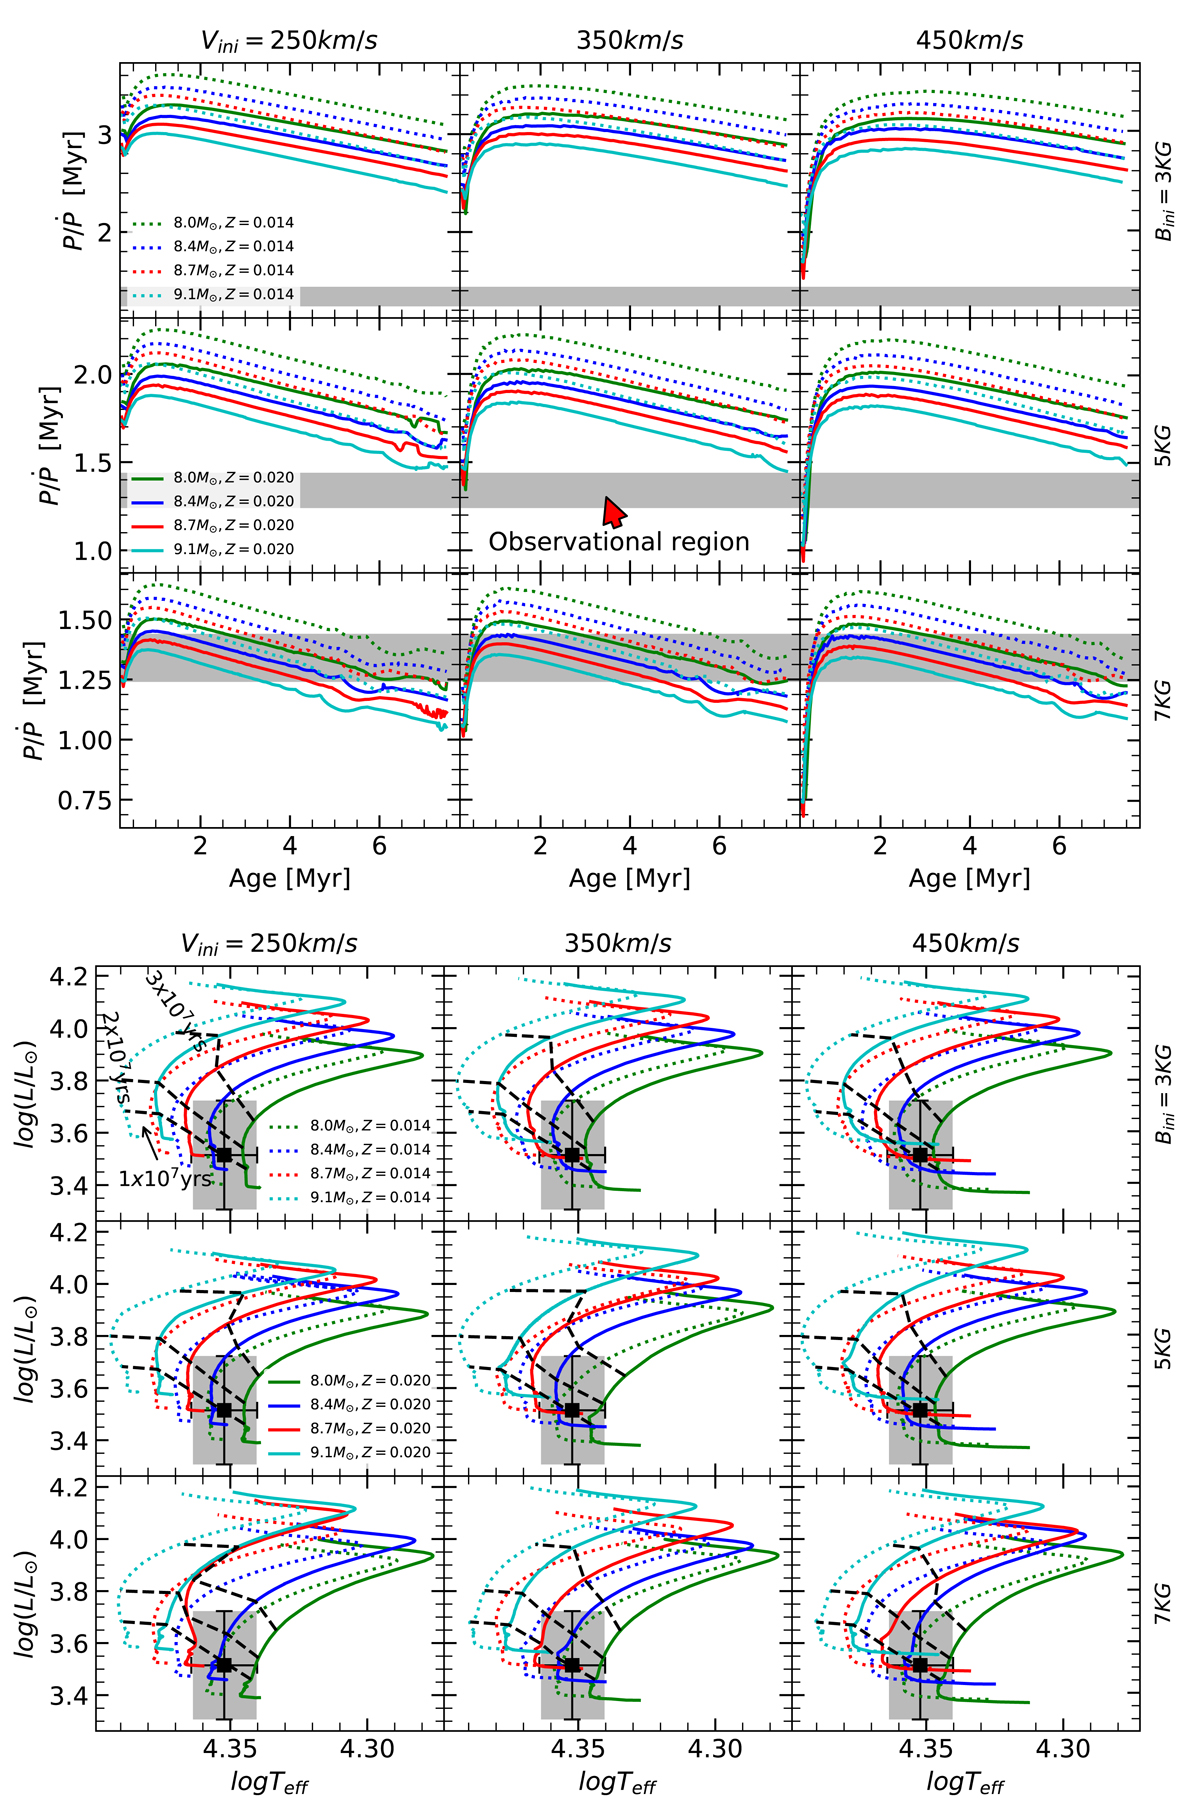
Top panel: evolution of Ṗ/P, where P is the rotation period, for stellar models with various initial masses, metallicities, rotations, and surface magnetic fields. The light shaded area shows the range of values for the braking timescale as deduced by Townsend et al. (2010). Bottom panel: evolutionary tracks for stellar models with various initial masses, metallicities, rotations, and surface magnetic fields. Three black dashed lines indicate the isochrones with ages ranging from 10 to 30 Myr. The position of σ Ori E is indicated.
Current usage metrics show cumulative count of Article Views (full-text article views including HTML views, PDF and ePub downloads, according to the available data) and Abstracts Views on Vision4Press platform.
Data correspond to usage on the plateform after 2015. The current usage metrics is available 48-96 hours after online publication and is updated daily on week days.
Initial download of the metrics may take a while.