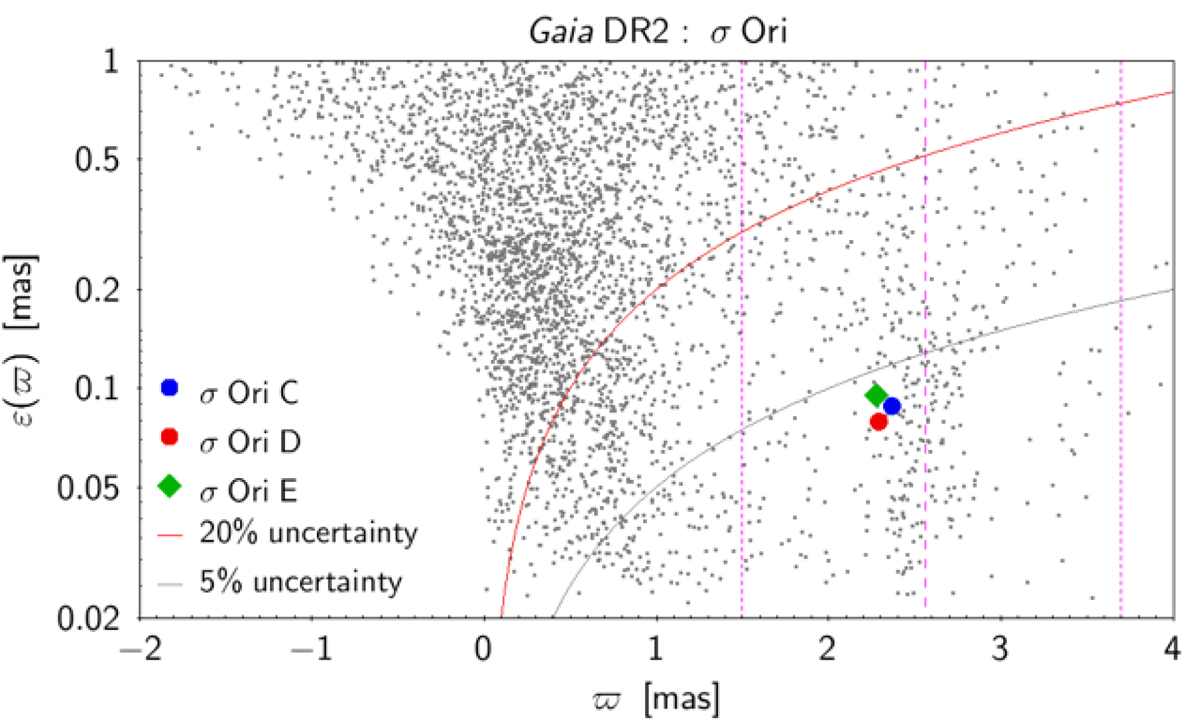
Fig. 3.
Download original image
Gaia DR2 parallax uncertainties versus parallax of all stars within a distance on the sky of 20 arcmin to the cluster center taken at the same position as in Fig. 1. The dashed and dotted vertical lines indicate the mean and limits of one standard deviation, respectively, of the parallaxes as determined by Caballero (2018) from cluster members. The red and gray solid lines indicate the parallax uncertainty limit at any given parallax below which the relative uncertainty is less than 20% and 5%, respectively. The positions of σ Ori C, D, and E in the diagram are indicated by the blue and red filled circles and the green filled diamond, respectively.
Current usage metrics show cumulative count of Article Views (full-text article views including HTML views, PDF and ePub downloads, according to the available data) and Abstracts Views on Vision4Press platform.
Data correspond to usage on the plateform after 2015. The current usage metrics is available 48-96 hours after online publication and is updated daily on week days.
Initial download of the metrics may take a while.