Fig. 1.
Download original image
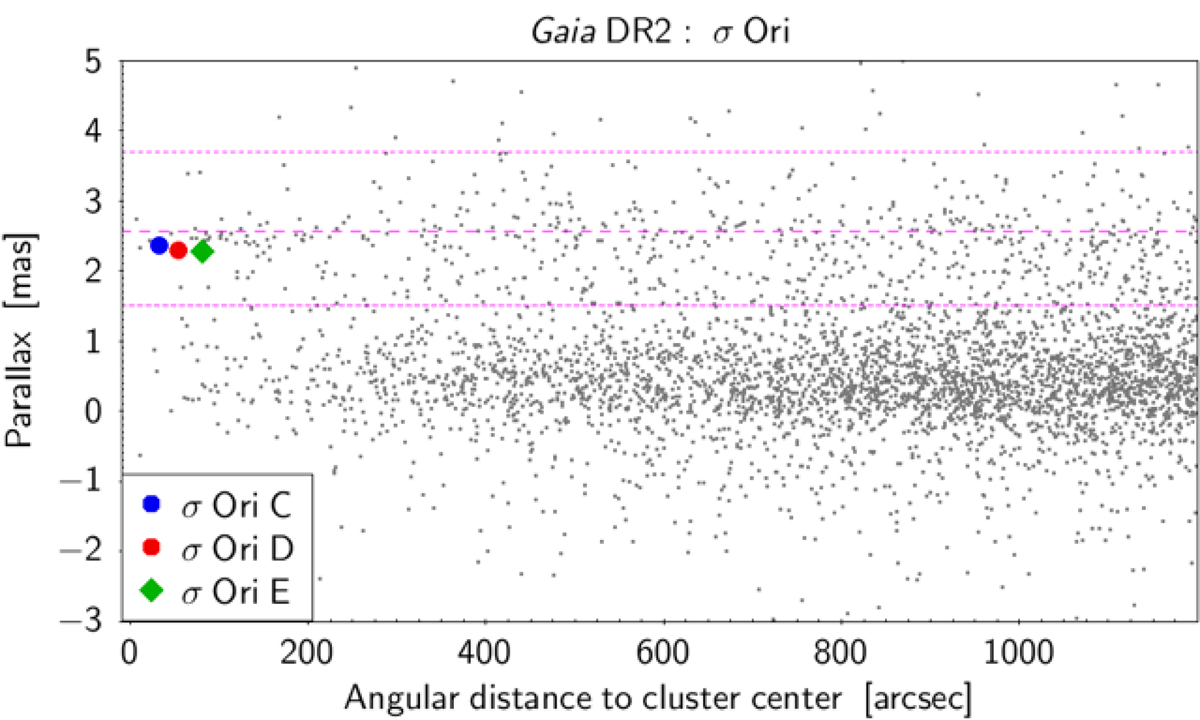
Gaia DR2 parallaxes of all stars in the direction of the σ Ori cluster versus their Gaia DR2 distance to the cluster center taken at (RA, Dec) = (84.675, −2.6) deg from Simbad. The dashed and dotted horizontal lines indicate the mean and the limits of one standard deviation, respectively, of the parallaxes as determined by Caballero (2018) from cluster members. The positions of σ Ori C, D, and E in the diagram are indicated by the blue and red filled circles and the green filled diamond, respectively.
Current usage metrics show cumulative count of Article Views (full-text article views including HTML views, PDF and ePub downloads, according to the available data) and Abstracts Views on Vision4Press platform.
Data correspond to usage on the plateform after 2015. The current usage metrics is available 48-96 hours after online publication and is updated daily on week days.
Initial download of the metrics may take a while.