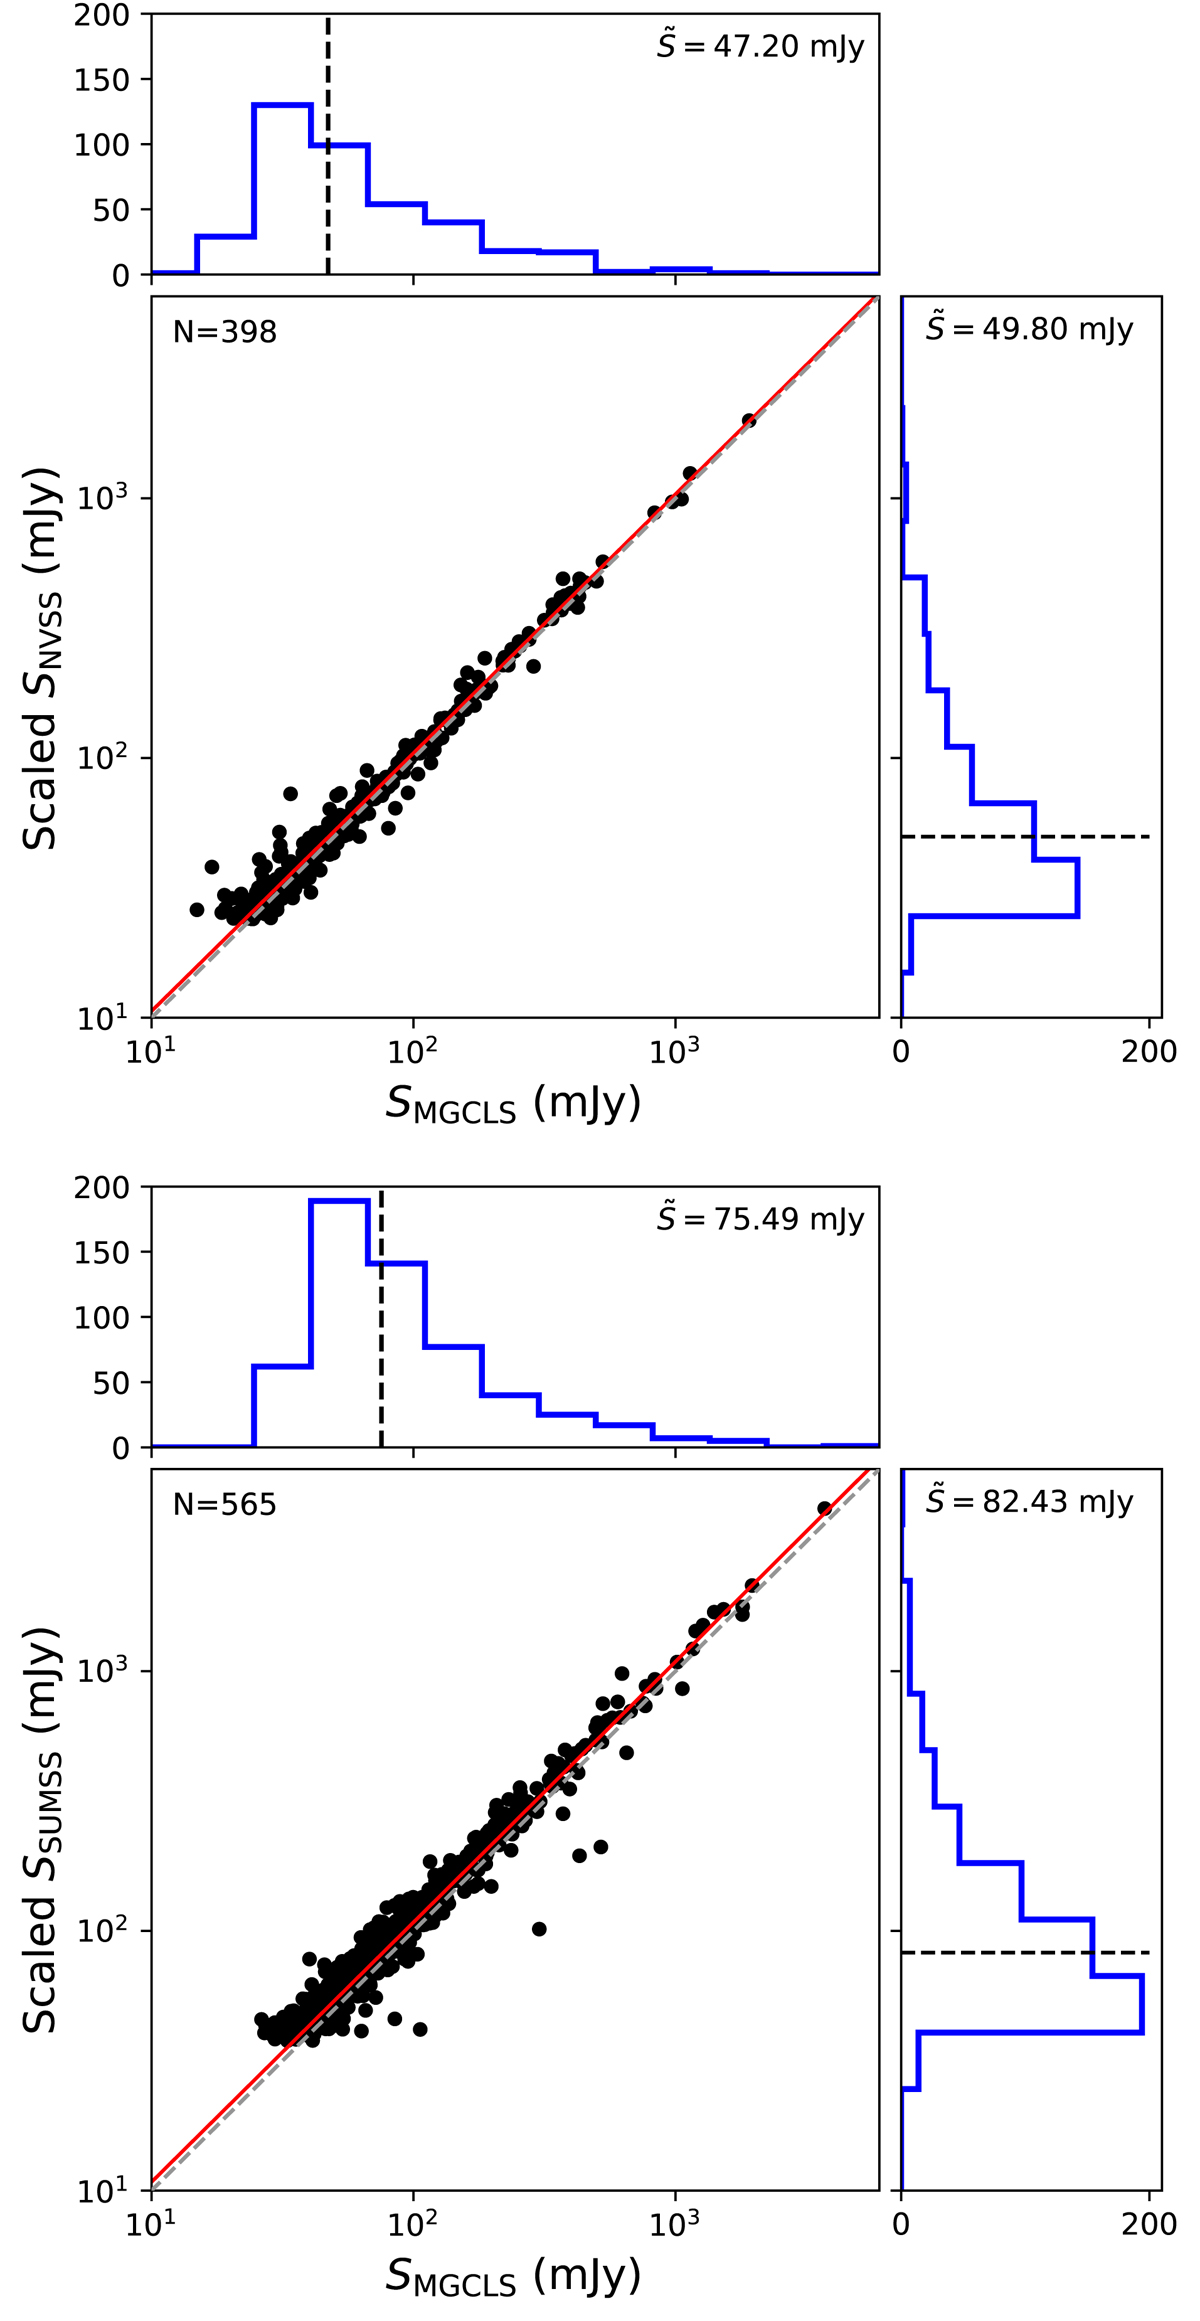
Fig. 3.
Download original image
Comparison between the integrated flux density of MGCLS compact sources with their counterparts in the NVSS (top) and SUMSS (bottom) catalogues, with the latter two being scaled to the MGCLS frequency of 1.28 GHz. The best-fit relation in each case is shown by the solid red line and is consistent with a linear relationship, with the number of sources in the fit shown in the upper left corner. The dashed grey line shows the exact one-to-one relationship. The scaled sky survey flux densities are typically 6% higher than their MGCLS counterparts, so this represents a possible small bias in the MGCLS flux scale. Histograms show the relevant flux density distributions, with the dashed black lines indicating the respective median values, ![]() .
.
Current usage metrics show cumulative count of Article Views (full-text article views including HTML views, PDF and ePub downloads, according to the available data) and Abstracts Views on Vision4Press platform.
Data correspond to usage on the plateform after 2015. The current usage metrics is available 48-96 hours after online publication and is updated daily on week days.
Initial download of the metrics may take a while.