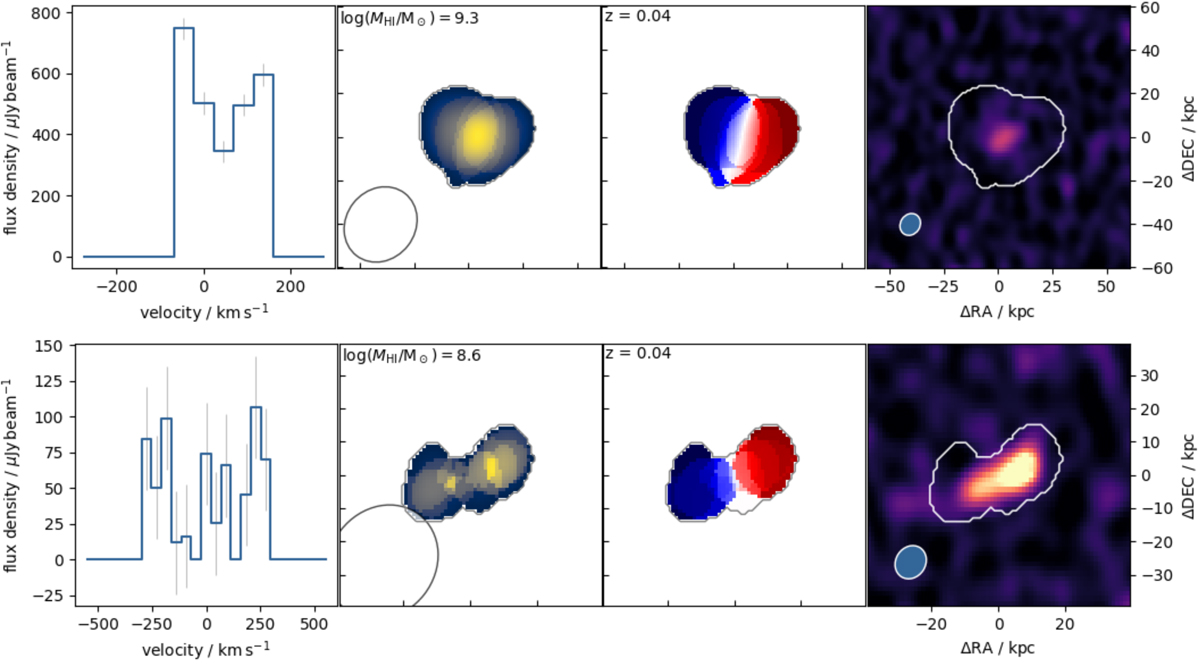
Fig. 29.
Download original image
Two demonstration examples of complementary H I and radio continuum science in the MGCLS from the Abell 3365 field. Both rows show H I discs at z ∼ 0.04 with radio continuum counterparts. Left: integrated H I spectrum with the per-channel standard deviation indicated by grey vertical bars. Centre left: total intensity H I map with the synthesised beam indicated in the lower left corner. The contour outlines the lowest level emission deemed real by the SOF IA source finding software (see Sect. 9.1.2 for details). The colour scale (from yellow to blue) shows the H I flux density from the left panel. Centre right: H I velocity map, with the colour scale (blue to red) set to the velocities for which there is non-zero flux density in the left panel. The contour is the same as in the centre left panel. Right: radio continuum intensity map, with the continuum synthesised beam indicated in the lower left corner. The colour range is between −20 and 200 μJy beam−1, and the contour is the same as in the centre left panel.
Current usage metrics show cumulative count of Article Views (full-text article views including HTML views, PDF and ePub downloads, according to the available data) and Abstracts Views on Vision4Press platform.
Data correspond to usage on the plateform after 2015. The current usage metrics is available 48-96 hours after online publication and is updated daily on week days.
Initial download of the metrics may take a while.