Fig. 2.
Download original image
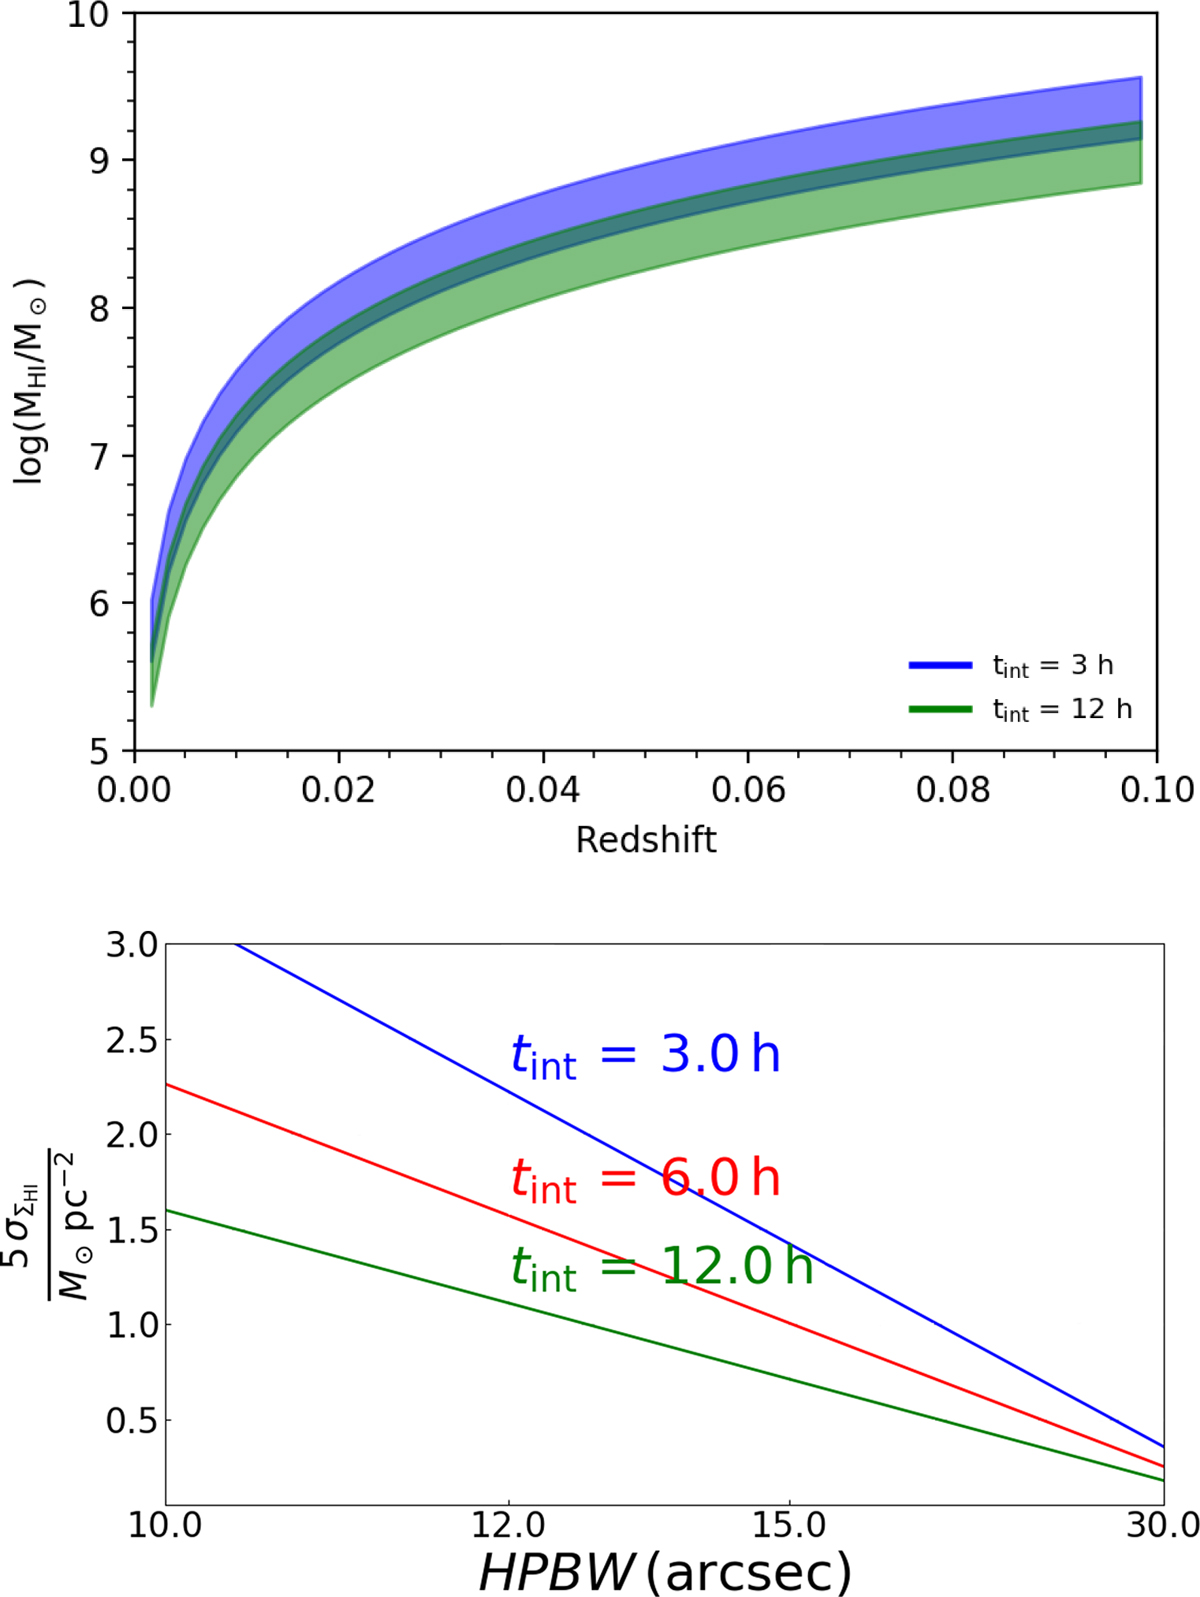
H I mass sensitivity for the MGCLS. Top: logarithm of the total H I mass sensitivity as a function of redshift for integration times between 3 h and 12 h (not all MGCLS datasets have the same usable on-source time for H I analysis). The shaded areas indicate the H I mass limits of the MGCLS data assuming a 5σ detection for a galaxy with line width ranging from 44 km s−1 to 300 km s−1. Bottom: column-density sensitivity versus angular resolution at z = 0.03 for different integration times present in the MGCLS. The horizontal axis scale is proportional to HPBW−2.
Current usage metrics show cumulative count of Article Views (full-text article views including HTML views, PDF and ePub downloads, according to the available data) and Abstracts Views on Vision4Press platform.
Data correspond to usage on the plateform after 2015. The current usage metrics is available 48-96 hours after online publication and is updated daily on week days.
Initial download of the metrics may take a while.