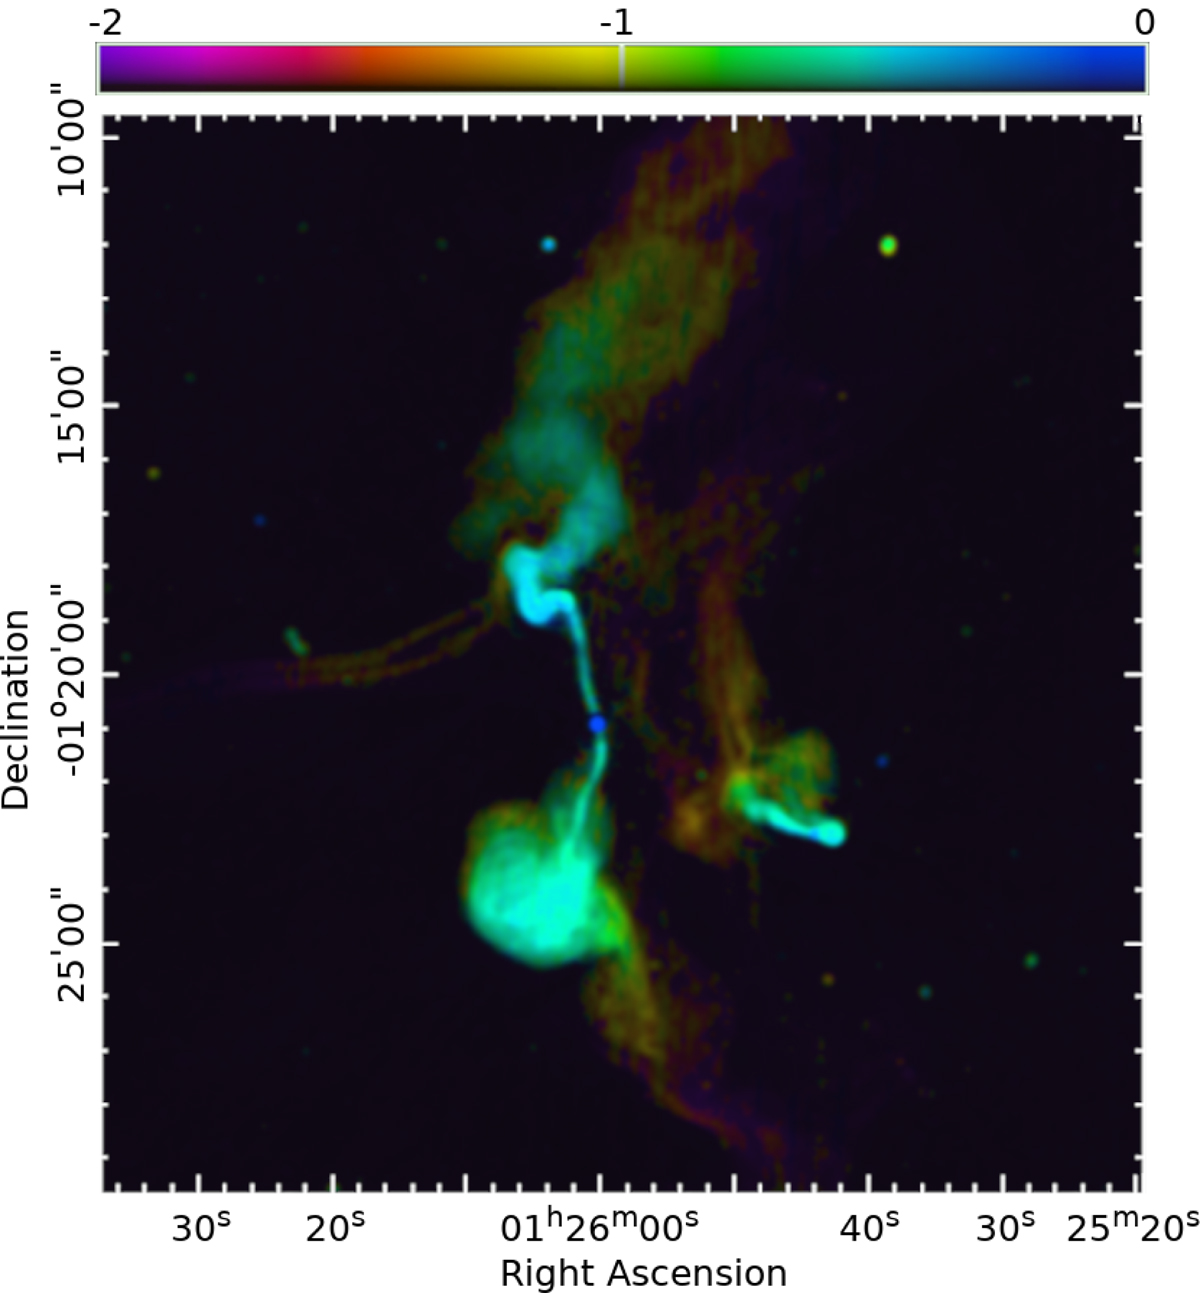
Fig. 18.
Download original image
Log intensity-coded MGCLS spectral index map of the 3C40A and 3C40B radio sources in Abell 194, at full resolution (7.7″ × 7.5″). Colours indicate the spectral index, and the brightness indicates the Stokes-I intensity. The colour bar indicates the spectral indices, with the upper (lower) part of the colour bar corresponding to the brighter (fainter) regions. The brightness is on a linear scale and saturates at 8 mJy beam−1.
Current usage metrics show cumulative count of Article Views (full-text article views including HTML views, PDF and ePub downloads, according to the available data) and Abstracts Views on Vision4Press platform.
Data correspond to usage on the plateform after 2015. The current usage metrics is available 48-96 hours after online publication and is updated daily on week days.
Initial download of the metrics may take a while.